10-K: Annual report [Section 13 and 15(d), not S-K Item 405]
Published on March 2, 2026
| UNITED STATES | ||
| SECURITIES AND EXCHANGE COMMISSION | ||
| Washington, D.C. 20549 | ||
| FORM | |||||
| (Mark One) | |||||
| ANNUAL REPORT PURSUANT TO SECTION 13 OR 15(d) OF THE SECURITIES EXCHANGE ACT OF 1934 | |||||
For the fiscal year ended December 31 , 2025
OR
| TRANSITION REPORT PURSUANT TO SECTION 13 OR 15(d) OF THE SECURITIES EXCHANGE ACT OF 1934 | |||||
Commission file number: 1-34036
(Exact name of registrant as specified in its charter)
| (State or other jurisdiction of incorporation or organization) | (I.R.S. Employer Identification Number) | |||||||
(Address of principal executive offices)
(312 ) 861-5900
(Registrant’s telephone number, including area code)
| Securities registered pursuant to Section 12(b) of the Act: | ||||||||||||||
| Title of Each Class | Trading symbol(s) | Name of Exchange on Which Registered | ||||||||||||
Securities registered pursuant to Section 12(g) of the Act: None
Indicate by check mark if the registrant is a well-known seasoned issuer as defined in Rule 405 of the Securities Act. Yes ☒ No ☐
Indicate by check mark if the registrant is not required to file reports pursuant to Section 13 or Section 15(d) of the Act. Yes ☐ No ☒
Indicate by check mark whether the registrant (1) has filed all reports required to be filed by Section 13 or 15(d) of the Securities Exchange Act of 1934 during the preceding 12 months (or for such shorter period that the registrant was required to file such reports), and (2) has been subject to such filing requirements for the past 90 days. Yes ☒ No ☐
Indicate by check mark whether the registrant has submitted electronically every Interactive Data File required to be submitted pursuant to Rule 405 of Regulation S-T during the preceding 12 months (or for such shorter period that the registrant was required to submit such files). Yes ☒ No ☐
Indicate by check mark whether the registrant is a large accelerated filer, an accelerated filer, a non-accelerated filer, smaller reporting company, or an emerging growth company. See definitions of “large accelerated filer,” “accelerated filer,” “smaller reporting company,” and “emerging growth company” in Rule 12b-2 of the Exchange Act.
| ☒ | Accelerated filer | ☐ | |||||||||
| Non-accelerated filer | ☐ | Smaller reporting company | |||||||||
| Emerging growth company | |||||||||||
| If an emerging growth company, indicate by check mark if the registrant has elected not to use the extended transition period for complying with any new or revised financial accounting standards provided pursuant to Section 13(a) of the Exchange Act. | ☐ | ||||||||||
Indicate by check mark whether the registrant has filed a report on and attestation to its management’s assessment of the effectiveness of its internal control over financial reporting under Section 404(b) of the Sarbanes-Oxley Act (15 U.S.C. 7262(b)) by the registered public accounting firm that prepared or issued its audit report. Yes ☒ No ☐
If securities are registered pursuant to Section 12(b) of the Act, indicate by check mark whether the financial statements of the registrant included in the filing reflect the correction of an error to previously issued financial statements. ☒
Indicate by check mark whether any of those corrections are restatements that required a recovery analysis of incentive-based compensation received by any of the registrant’s executive officers during the relevant recovery period pursuant to §240.10D-1(b). ☒
Indicate by check mark whether the registrant is a shell company (as defined in Rule 12b-2 of the Exchange Act). Yes ☐ No ☒
The aggregate market value of common stock held by non-affiliates of the registrant on the last business day of the registrant’s most recently completed second fiscal quarter was: $6,184,278,020 .
At February 23, 2026, there were 51,982,204 shares of the registrant’s common stock outstanding.
DOCUMENTS INCORPORATED BY REFERENCE
Portions of the registrant’s Proxy Statement for the 2026 Annual Meeting of Stockholders are incorporated herein by reference in Part III of this Annual Report on Form 10-K to the extent stated herein.
TABLE OF CONTENTS
| Page | |||||
Item 5. Market for Registrant’s Common Equity, Related Stockholder Matters and Issuer Purchases of Equity Securities | |||||
Item 6. [Reserved] | |||||
2
EXPLANATORY NOTE
In conjunction with the combination of John Bean Technologies Corporation and Marel hf., the corporation changed its name and stock ticker symbol to “JBT Marel Corporation” and “JBTM”, respectively, effective January 2, 2025. Unless otherwise specified or indicated by context, references herein to “JBT Marel”, “JBT Corporation”, “JBT”, “we”, “us”, “our” and the “Company” refer to John Bean Technologies Corporation and its subsidiaries for periods ending on or before the name change and to JBT Marel Corporation and its subsidiaries for periods ending after the name change.
SPECIAL NOTE ABOUT FORWARD-LOOKING STATEMENTS
This Annual Report on Form 10-K and other materials filed or to be filed by us with the Securities and Exchange Commission, as well as information in oral statements or other written statements made or to be made by us, contain statements that are, or may be considered to be, forward-looking statements. All statements that are not historical facts, including statements about our beliefs or expectations, are forward-looking statements. You can identify these forward-looking statements by the use of forward-looking words such as “outlook,” “believes,” “expects,” “potential,” “continues,” “may,” “will,” “should,” “seeks,” “approximately,” “predicts,” “intends,” “plans,” “estimates,” “anticipates,” “foresees” or the negative version of those words or other comparable words and phrases. Any forward-looking statements contained in this Annual Report on Form 10-K are based upon our historical performance and on current plans, estimates and expectations. The inclusion of this forward-looking information should not be regarded as a representation by us or any other person that the future plans, estimates or expectations contemplated by us will be achieved. These forward-looking statements include, among others, statements related to our business and our results of operations, our strategic plans, our restructuring plans and expected cost savings from those plans and our liquidity. The factors that could cause our actual results to differ materially from expectations include but are not limited to the following factors:
•fluctuations in our financial results;
•termination or loss of major customer contracts and risks associated with fixed-price contracts, particularly during periods of high inflation;
•catastrophic loss at any of our facilities and business continuity of our information systems;
•loss of key management and other personnel;
•our ability to remediate the material weaknesses relating to the Marel financial statements;
•deterioration of economic conditions, including impacts from supply chain delays and reduced material or component availability;
•unanticipated delays or acceleration in our sales cycles;
•inflationary pressures, including increases in energy, raw material, freight, and labor costs;
•changes in food consumption patterns;
•weather conditions and natural disasters;
•impacts of pandemic illnesses, food borne illnesses and diseases to various agricultural products;
•work stoppages;
•customer sourcing initiatives;
•competition and innovation in our industries;
•disruptions in the political, regulatory, economic and social conditions of the countries in which we conduct business;
•changes to tariffs, trade regulations, quotas, or duties;
•potential liability arising out of the installation or use of our systems;
•the impact of climate change and environmental protection initiatives;
•our ability to comply with U.S. and international laws governing our operations and industries;
•increases in tax liabilities;
•risks related to acquisitions, such as our ability to integrate the acquisitions we have consummated, including the integration of the legacy businesses of JBT and Marel;
•our ability to develop and introduce new or enhanced products and services and keep pace with technological developments;
•difficulty in developing, preserving and protecting our intellectual property or defending claims of infringement;
•cybersecurity risks such as network intrusion or ransomware schemes;
•our convertible note hedge and warrant transactions;
•the maintenance of two stock exchange listings;
•fluctuations in currency exchange rates and interest rates;
•our level of indebtedness;
•availability of and access to financial and other resources; and
•the factors described under the captions “Risk Factors” and “Management’s Discussion and Analysis of Financial Condition and Results of Operations” in this Annual Report on Form 10-K.
If one or more of those or other risks or uncertainties materialize, or if our underlying assumptions prove to be incorrect, actual results may vary materially from what we projected. Consequently, actual events and results may vary significantly from those included in or contemplated or implied by our forward-looking statements. The forward-looking statements included in this Annual Report on Form 10-K are made only as of the date hereof, and we undertake no obligation to publicly update or revise any
3
forward-looking statement made by us or on our behalf, whether as a result of new information, future developments, subsequent events or changes in circumstances or otherwise.
4
PART I
5
ITEM 1. BUSINESS
GENERAL
We are a leading and diversified global technology solutions and service provider to high-value segments of the food and beverage industry. We design, produce, and service sophisticated products and systems for multi-national and regional customers. Our purpose is to transform the future of food by providing solutions that substantially enhance our customers’ success, and in doing so design, produce and service sophisticated and critical products and systems for food and beverage companies that increase yields, boost efficiency, and improve food safety.
We were originally incorporated in Delaware in May 1994. Our principal executive offices are located at 333 West Wacker Drive, Suite 3400, Chicago, Illinois 60606 and our European headquarters is located at Austurhraun 9, 210 Gardabaer, Iceland.
Operating results and additional financial data and commentary are provided in the Results of Continuing Operations section in Part II, Item 7. Management’s Discussion and Analysis of Financial Condition and Results of Operations of this Annual Report on Form 10-K.
Strategic Acquisition of Marel hf.
On January 2, 2025, we completed the acquisition of Marel hf. (“Marel”), subsequently renamed JBT Marel ehf. (such acquisition, the “Marel Transaction”). The purpose of the Marel Transaction was to create a leading and diversified global food and beverage technology solutions provider by bringing together two renowned companies with long histories, complementary product portfolios, highly respected brands, and cutting-edge technology to enable global customers to more efficiently access industry leading technology worldwide. Refer to Note 2. Acquisitions of the Notes to the Consolidated Financial Statements for additional information.
In conjunction with the combination of JBT and Marel, JBT changed its corporate name and stock ticker symbol to “JBT Marel Corporation” and “JBTM,” respectively, on January 2, 2025. Shares of JBTM remain listed on the New York Stock Exchange (NYSE) with a secondary listing on Nasdaq Iceland. Shares of JBTM commenced trading on both NYSE and Nasdaq Iceland on January 3, 2025.
Business Segments
Following the acquisition of Marel, we operated through two segments, JBT and Marel, which were comprised of the legacy operations of each business. During the fourth quarter of 2025, we realigned our reportable segments to better reflect the integration of our new operating model. We now operate through two reportable segments: Protein Solutions and Prepared Food and Beverage Solutions.
The Protein Solutions segment includes businesses that provide solutions for initial stage processing and harvesting of animal proteins, primarily focusing on poultry, pork, fish, and beef. Examples of core technologies include primary processing systems, cut-up, bone detection and removal, portioning, and robotic batching.
The Prepared Food and Beverage Solutions segment includes businesses that offer solutions predominantly for downstream value-added preparation, preservation, and packaging of foods and beverages into ready to eat or drink products. This segment also includes capabilities for pet food, dairy, bakery, pharmaceutical and nutraceutical, and warehouse automation end markets. Examples of core technologies include meat preparation, forming, cutting, slicing, cooking, freezing, extraction, blending, filling, preservation, labeling, packaging, and automated guided vehicles.
For further segment information, see Part II, Item 7: Management’s Discussion and Analysis of Financial Condition and Results of Operations and Note 20 of the Notes to Consolidated Financial Statements in Part II, Item 8: Financial Statements and Supplementary Data of this Form 10-K.
6
DESCRIPTION OF BUSINESS
We provide comprehensive solutions throughout the food production value chain, extending from primary processing through labeling and packaging systems for a large variety of food and beverage end markets, including poultry, beef, pork, seafood, ready-to-eat meals, fruits, vegetables, plant-based meat alternatives, dairy, bakery, pet foods, soups, sauces, juices, and aqua feed. Our solutions also support nutraceutical and powder applications. We also provide stand-alone, fully integrated, and dual-mode robotic automated guided vehicle systems for repetitive material handling requirements with a wide variety of applications, including automotive manufacturing, warehousing, and medical facilities.
Our equipment offerings include primary, secondary and further value-added processing, including standalone and full-line solutions, software and services for live animal handling, stunning, slaughtering, scalding/dehairing, chilling, mixing/grinding, separation, injecting, blending, marinating, tumbling, flattening, forming, portioning, coating, cooking, frying, freezing, extracting, pasteurizing, sterilizing, concentrating, high pressure processing, weighing, inspecting (using the latest x-ray technology), filling, closing, sealing, end of line material handling, labeling, and packaging solutions, which support a large and growing portfolio of food, beverage, and health end markets.
Our historically strong position in the markets we serve has provided us with a large installed base of systems and equipment that is a source of recurring revenue from our aftermarket parts and service offerings and re-build services for customer-owned equipment. We offer full service operating leases on certain high-capacity industrial extractors, which include routine parts and maintenance support. Recurring revenue accounted for 50% of total revenue in 2025.
We believe our success is derived from continued innovation, applying differentiated and proprietary technologies to meet customers’ food and beverage processing needs. We continually strive to improve existing products and develop new solutions by working closely with our customers to meet their evolving needs. The installed base of our systems and equipment also provides us with strong, long-term customer relationships from which we derive information for new product development to meet the evolving needs of our customers.
We have operations strategically positioned around the world to serve our existing equipment installed base. We operate more than 50 manufacturing and distribution facilities worldwide. Our principal production facilities are located in the United States (Arkansas, California, Florida, Georgia, Kansas, New York, North Carolina, Ohio, Pennsylvania, Virginia and Wisconsin), Brazil, Belgium, China, Denmark, Germany, Iceland, India, Italy, Slovakia, Spain, Sweden, the Netherlands, and the United Kingdom. Including our sales and services offices, we have operations based in more than 30 countries, and we also support our customers in their development of new food products and processes as well as the refinement and testing of their current applications through 17 technical centers located in the United States (California, Florida, Iowa, Kansas, and Ohio), Mexico, Brazil, Belgium, Denmark, Germany, Italy, Spain, Sweden, and the Netherlands. Our global presence allows us to provide direct customized support to customers virtually anywhere they process food.
Sale of AeroTech
On August 1, 2023, we completed the sale of the AeroTech business segment (“AeroTech”). This sale was completed pursuant to the Stock and Asset Purchase Agreement, dated May 26, 2023, to sell AeroTech to Oshkosh Corporation. This divestiture supported the Company’s strategy to become a pure-play food and beverage solutions provider. For additional information, refer to Note 3. Discontinued Operations of the Notes to the Consolidated Financial Statements.
Solutions, Products and Services
We offer a broad portfolio of systems, equipment and services to our customers which are often sold as part of a fully integrated processing line solution. Our systems are typically customized to meet a large variety of customer application needs within food and beverage end markets, including poultry, beef, pork, seafood, ready-to-eat meals, fruits, vegetables, plant-based meat alternatives, dairy, bakery, pet foods, soups, sauces, juices, and aqua feed. Thus, actual production capacity ranges vary and are dependent on the food and product packaging type being processed. Our fully integrated processing lines often span from the initial point of entry of raw products through further processing and end of line packaging.
The initial step in the food processing cycle is primary processing, where the edible food product is extracted from the raw commodity or preserved in its raw form to increase shelf life. Our primary processing offerings increase food yield, lower energy and water usage, reduce food waste, and enhance food safety. In the primary processing space, we offer solutions for meat, fish, and poultry applications, and fruit and vegetable processing equipment. Products in the primary processing space include:
•live bird handling systems;
•poultry overhead and conveyance systems;
•offal and feather processing;
7
•meat and poultry processing applications, including stunning, bleeding, scalding, picking, evisceration, maceration, water re-use, paw processing, cut-up and deboning, wing segmentation, and skinning equipment;
•pathogen protection for poultry and meat applications;
•freezing, chilling, refrigeration, and proofing systems;
•industrial citrus, tropical and temperate fruit and vegetable processing equipment, including cleaning, grading, storing, feeding, finishers, pulp systems, evaporators, ingredient recovery systems, slicing, washing, drying, transporting, and mixing;
•specially formulated fruit and vegetable cleaners, post-harvest sanitizers, fungicides, and coatings;
•skid-mounted products, including solutions for aseptic sterilization, bulk filling, and labelling, as well as ingredient and by-product recovery and clean-up systems; and
•high-capacity industrial juice extractors; and
•point of use produce juicers for retail markets.
The next step in the food processing cycle is secondary processing where the raw ingredients prepared through primary processing are transformed into consumable food products or are further preserved. Our secondary processing offerings add further value by transforming food into a more marketable and edible product while reducing labor through automation, increasing yields, improving product quality, reducing energy and water usage, lowering food waste, and enhancing food safety. In the secondary processing space, we supply a broad portfolio of processing solutions for customers producing protein products, such as meat, poultry, and seafood, and liquid food and beverage products, including products used standalone or as ingredients in dairy products, bakery products, and fruit-based beverages. Products in the secondary processing space include:
•meat, fish, and poultry processing functions, including tenderization, portioners and waterjet portioners, slicers and cordon-bleu slicers, attribute scanners/sorters, injectors, scales and weighing systems, brine preparation, injection, marination, mixers, grinders, flatteners, formers, and tenderizers;
•x-ray detection systems created for the unique needs of poultry, meat, and fish;
•aseptic systems, including sterilizers, fillers, blow molders and controls that can be used for bulk or retail production of diverse products such as not-from concentrate orange juice, milk, alt-dairy, purees, soups, sauces, and concentrates;
•flavor vats, batching systems, melting systems, and storage tanks;
•fully integrated industrial preservation systems that enable production of extended shelf life and shelf-stable foods in a wide variety of flexible, rigid, and semi-rigid packages;
•rotary and linear filling and closing technologies for metal cans, glass jars, glass and plastic bottles, and pouches; and
•integrated solutions for the processing of extended shelf life and shelf-stable food and liquid products including a line of continuous hydrostatic sterilizers, continuous rotary sterilizers, batch retorts, heat exchangers, and thermal process controls.
The final step in the food processing cycle is further processing where the food product is further refined through a variety of different value-added techniques for broader or more convenient consumption. Our further processing offerings enhance the quality of the final food product while reducing labor through automation, improving product quality, reducing energy and water usage, lowering food waste, and enhancing food safety. In the further processing space, we supply a comprehensive portfolio of high-volume industrial batch and continuous cooking and freezing solutions, in addition to capabilities in filling, mixing and blending, high pressure processing extrusions, fresh-cut produce, infant food, pet food, snacks, cereals, texturized vegetable and meat proteins, and pharma/nutraceuticals. Products in the further processing space include:
•cookers, fryers, spiral and linear ovens and cooking systems, coating and seasoning applicators, pasteurizers, and proofers;
•design, assembly, testing, and installation of self-stacking spiral ovens, freezers, chillers, individual quick freezing (IQF) systems, linear/impingement freezing systems, and flat product and contact freezers;
•equipment to clean, mix, grade, sort, and blanch produce, fresh-cut salads, fruits, and vegetables;
•powder and linear fillers, and vacuum fillers, a leading filler for high-value powdered food;
•solutions for blending, filling, container handling and seaming on high-capacity beverage lines packaged in cans or bottles;
•high-pressure processing equipment, supporting clean-label products and non-thermal preservation solutions for a broad array of market segments;
•continuous extrusion cooking, drying, coating, and cooling equipment and process systems for the pet food, human food, and aqua-feed end market segments;
•integrated solutions services for end-to-end facility and food safety design, process flows, total cost of ownership analysis, project management, commissioning, training, and process system auditing;
•full line solutions for wet and dry pet food and treat producers; and
•modularized tanks, skids, and bioreactors as well as installation of sanitary/high purity piping that plays a vital role in producing vaccines and medicines.
8
In the packaging space, we supply labeling and packaging systems, tray seal packaging equipment, weigh price labelers and case packers providing automatic in-line solutions for the food segment. Our tray sealing solutions help extend the shelf life of packaged food and can reduce plastic consumption versus traditional packaging methods, offering solutions in a wide range of industries including, food, pharmaceutical, and retail markets.
We are a recognized U.S. Department of Agriculture (“USDA”) and Food and Drug Administration (“FDA”) Food Process Authority and offer consulting services to help design food production processes in accordance with the USDA’s and FDA’s stringent requirements. Our solutions also include specialized material handling systems to automate the handling and tracking of processed and unprocessed containers as well as software and controls provided by AutoCoding Systems that help our customers optimize and track their processes to allow real time modifications in the case of process deviations.
Across our equipment and technologies, we create shared value for our food and beverage customers by offering high-quality, technologically advanced, and reliable solutions that deliver quality performance while also striving to support customer sustainability objectives. As a result, many of our solutions seek to minimize food and packaging waste, extend food product life, optimize and reduce water and energy usage, increase yield and maximize efficiency.
Automated Systems. We are a leading global supplier of robotic automated guided vehicle systems for material handling requirements with a wide variety of applications, including automotive manufacturing, warehousing, and medical facilities. We provide engineering services and simulations to evaluate material handling requirements, standard and custom automated guided vehicle hardware and software, and fully integrated system hardware and software for a scalable solution that can be applied individually or across the entire customer enterprise.
Aftermarket Products, Consumables, Parts, and Services. We provide aftermarket products, parts, and services for all of our integrated food processing systems and equipment. We provide retrofits and refurbishments to accommodate changing operational requirements, and we supply our own brand of food grade lubricants and cleaners designed specifically for our equipment. We supply packaging material components for our clip packaging customers in the form of metal clips and hanging loops. We also provide continuous, proactive service to our customers including through the fulfillment of preventative maintenance agreements and consulting services such as water treatment, corrosion monitoring control, food safety and process auditing, and the expertise of on-site technical personnel. In addition to helping our customers reduce their operating costs and improve efficiencies, our customer service focus also helps us maintain strong commercial relationships and provides us with ongoing access to information about our customers’ requirements and strategies to foster continuing product development. Our aftermarket products, parts, and services, coupled with our large installed base of food processing systems and equipment, provide us with a strong base for growing recurring revenue. Sales of aftermarket products, parts and services are consolidated within the total revenue of the related business.
We offer AXIN, our advanced, overarching food processing software platform, which can be installed alongside our equipment and systems, as well as third-party equipment to optimize production, manage complex operating challenges and facilitate reporting regarding compliance. Integrated with hardware, AXIN ranges from simple machine control modules to total processing solutions, which include real-time monitoring and data analytics of key performance indicators such as yield, throughput, quality, capacity and labor efficiency.
We also provide proactive services to our customers including the fulfillment of preventative maintenance agreements, such as PRoCARE® and consulting services. Those include service, parts availability, and machine optimization capabilities - powered by AXIN built on a digital infrastructure leveraging AI, machine learning, and predictive analytics.
Order Backlog
For information regarding our order backlog, refer to the section entitled “Inbound Orders and Order Backlog” in Item 7. Management’s Discussion and Analysis of Financial Condition and Results of Operations of this Annual Report on Form 10-K
Sales and Marketing
We sell and market our products and services predominantly through a direct sales force, supplemented with independent distributors, sales representatives, and technical service teams. Our experienced global sales force is comprised of individuals with strong technical expertise in our products and services and the industries in which they are sold.
We support our sales force with marketing and training programs that are designed to increase awareness of our product offerings and highlight our differentiation while providing a set of sales tools to aid in the sales of our technology solutions. We actively employ a broad range of marketing programs to inform and educate customers, the media, industry analysts, and academia through targeted newsletters, our website, blogs, social media platforms, seminars, trade shows, user groups, and conferences. We regularly
9
introduce new internal digital resources designed to accelerate the quote-to-order process, identify cross-selling opportunities between our separate businesses. In addition, we utilize marketing automation processes and technology to drive lead generation.
Competition
We conduct business worldwide and compete with large multinational companies as well as a variety of local and regional companies of various sizes and cost structures, which typically are focused on a specific application, technology or geographical area. All of our business lines serve highly competitive markets.
JBT Marel’s major competitors include, but are not limited to, Advanced Equipment Inc.; Alit SRL; Allpax Products, Inc.; Atlas Pacific Engineering Company, Inc.; Baader GmbH & Co. KG; Barry-Wehmiller Companies, Inc.; Brown International Corp.; Bühler Group; DSI Dantech A/S; Duravant LLC; Elettric 80 S.p.a. Italia; Ferrum; Fortifi Food Processing Solutions; FPS Process Foods Solutions; GEA Group AG; Heinen Freezing GmbH & Co. KG; Jarvis Products Corporation; Krones; METALQUIMIA, S.A.; Mettler-Toledo International, Inc.; Meyn Food Processing Technology B.V.; Middleby Corporation; Morris & Associates, Inc.; MYCOM; Nantong Freezing Equipment Company, Ltd.; Poly-clip system GmbH & Co. KG; ProMach Inc; Provisur Technologies, Inc.; Shibuya Corporation; Square Technology Group Co., Ltd; Starfrost; Statco Engineering; Steriflow SAS.; Tecnopool S.p.A; and Tetra Laval.
We compete by leveraging our industry expertise to provide differentiated and proprietary technology, integrated systems, high product quality and reliability, and comprehensive aftermarket services for our installed base of equipment. Furthermore, this installed base also provides us with strong, long-term customer relationships from which we derive information for new product development to meet the evolving needs of our customers. We strive to provide our customers with equipment that delivers a lower total cost of ownership, distinguishing ourselves by providing reliable uptime, labor reduction through automation, increased yields, and improved product quality, while helping customers achieve ambitious environmental goals of lowering energy and water usage, reducing food waste, and enhancing food safety. Our ability to provide comprehensive sales and service in all major regions of the world, by maintaining local personnel in region, differentiates us from regional competition.
Geographic Information
We operate more than 50 manufacturing and distribution facilities, strategically positioned around the world to serve our existing equipment base. See Item 1A. Risk Factors for a discussion of risks associated with our global operations.
Customers
No single customer accounted for more than 10% of our total revenue in any of the last three fiscal years.
Patents, Trademarks and Other Intellectual Property
We seek to protect and enhance our proprietary intellectual property rights through patent, copyright, trademark, and trade secret laws, as well as through technological safeguards and operating policies and procedures designed and implemented by our intellectual property team. We own a number of United States and foreign patents, trademarks, and licenses that are cumulatively important to our business. We own approximately 2,880 United States and foreign issued patents and have approximately 781 patent applications pending in the United States and abroad. Further, we license certain intellectual property rights to or from third parties. We also own numerous United States and foreign trademarks and trade names and have approximately 1,172 registrations and pending applications in the United States and abroad. Developing and maintaining a strong intellectual property portfolio is an important component of our strategy to extend our technology leadership. However, we do not believe that the loss of any one or group of related patents, trademarks, or licenses would have a material adverse effect on our overall business.
Sources and Availability of Raw Materials
We purchase carbon steel, stainless steel, aluminum, and/or steel castings, forgings and sheet metal both domestically and internationally. We do not use single source suppliers for the majority of our raw material purchases and believe the available supplies of raw materials are adequate to meet our needs. By working closely with our supply base, primarily through supply chain and strategic sourcing initiatives that include supply base consolidation, “make” versus “buy” decisions, value engineering and component standardization, and best cost country sourcing, we have improved lead times and stabilized raw material costs.
Working Capital Practices
In order to provide, and install, custom designed equipment, companies in the food machinery industry generally generate customer deposits, or advance payments, before construction begins. For this reason, our business can be less working capital intensive than many other industrial capital goods industries.
10
Human Capital Management
As of December 31, 2025, we employed approximately 11,500 people worldwide, with approximately 27% located in the United States. None of our employees in the United States are represented by collective bargaining agreements. Outside the United States, we maintain employment agreements where required or customary, consistent with local laws and practices. Approximately 75% of our international workforce is covered by employee representation bodies, including works councils and other formal structures. We have historically maintained constructive relationships with employees and have completed recent negotiations without work stoppages; however, future outcomes cannot be assured.
Culture and Values. Our employees are essential to delivering on our purpose to Transform the Future of Food, and our culture is grounded in four core values: Create with Collaboration, Serve with Integrity, Grow with Excellence, and Advance with Innovation. These values shape how we work together and support our long-term competitiveness. They also reflect input from employees across both legacy companies and are foundational to building a unified, inclusive culture.
Inclusion and Belonging. We are committed to fostering a workplace where employees feel included, valued, and connected. Following the combination of JBT and Marel, we are bringing together employees across functions and geographies to ensure inclusion and belonging are embedded in how we work globally. In addition, our Employee Network Communities (ENCs), including the Women’s Inclusion Network (WIN), Black Employees Supporting Talent (BEST), and a Global Veteran’s Network, provide forums for community-building, shared experiences, and professional development.
Additional employee groups are established based on employee interest. We regularly gather employee feedback through surveys and other listening channels, and we use this information to develop targeted action plans that strengthen engagement across segments, functions and regions.
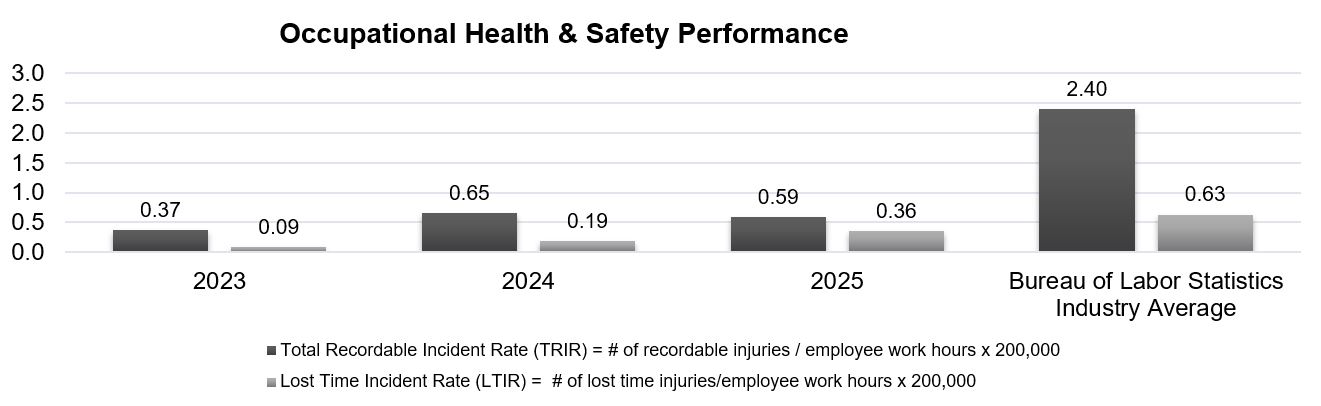
Employee Safety and Well-Being. The safety and well-being of our employees, contractors, and visitors remains a top priority. We have implemented a global Health, Safety, and Environment (HSE) policy and a unified HSE management system designed to ensure consistent standards across our operations. Our safety practices emphasize proactive hazard reporting, near-miss identification, and behavior-based safety observations to prevent injuries before they occur.
Continuous improvement in accident prevention is achieved through the global near miss and behavior-based safety program. Our safety performance, including Total Recordable Incident Rate (TRIR) and Lost Time Incident Rate (LTIR), remained significantly below relevant industry averages. Safety performance is reviewed with the Board of Directors at every regular meeting.
Talent, Learning, and Development. We invest in talent to support employee growth and our long-term strategy. Our performance management approach emphasizes both what employees achieve and how they achieve results, reflecting our values. We are integrating the development programs and digital learning platforms from both legacy companies to build a comprehensive JBT Marel learning portfolio. Employees have access to a range of development opportunities, including safety training, technical skills, leadership development, professional development, and courses delivered through our digital learning systems.
Our structured annual talent development review process, including succession planning, assessments, leadership frameworks, and programs that support career advancement, helps ensure a strong pipeline of future leaders across the company.
11
Total Rewards. We provide competitive and comprehensive total rewards programs to retain and attract talent globally. These offerings include competitive base pay, incentive opportunities, health coverage for employees and dependents, retirement contributions, paid time off, tuition reimbursement, parental leave, and a variety of well-being programs such as mental health resources, employee assistance programs, and fitness reimbursements.
Human Rights and Ethical Conduct. We are committed to respecting human rights across our operations. Our Human Rights Policy is aligned with the UN Universal Declaration of Human Rights, the UN Guiding Principles on Business and Human Rights, and the International Labour Organization conventions, including those related to freedom of association and collective bargaining. Employees complete training on the JBT Marel Guide to Ethical Conduct, which sets expectations for responsible behavior and provides confidential channels to report concerns without fear of retaliation.
Community Support. Through corporate giving, volunteerism, and employee-driven initiatives, we support communities where we operate. Our giving programs are aligned with the UN Sustainable Development Goals and include matching gift programs and local initiatives focused on food security, education, and community well-being.
For details on risks related to management retention and attraction, see “Part 1. Item 1A. Risk Factors.” Our leadership’s dedication ensures our ongoing growth and reinforces our inclusive competitive edge.
Governmental Regulation and Environmental Matters
Our operations are subject to various federal, state, local, and foreign laws and regulations governing the prevention of pollution and the protection of environmental quality. If we fail to comply with these environmental laws and regulations, administrative, civil, and criminal penalties may be imposed, and we may become subject to regulatory enforcement actions in the form of injunctions and cease and desist orders. We may also be subject to civil claims arising out of an accident or other event causing environmental pollution. These laws and regulations may expose us to liability for the conduct of, or conditions caused by, others or for our own acts even though these actions were in compliance with all applicable laws at the time they were performed.
Under the Comprehensive Environmental Response, Compensation and Liability Act, referred to as CERCLA, and related state laws and regulations, joint and several liability can be imposed without regard to fault or the legality of the original conduct on certain classes of persons that contributed to the release of a hazardous substance into the environment. These persons include the owner and operator of a contaminated site where a hazardous substance release occurred and any company that transported, disposed of, or arranged for the transport or disposal of hazardous substances that have been released into the environment, including hazardous substances generated by any closed operations or facilities. In addition, neighboring landowners or other third parties may file claims for personal injury, property damage, and recovery of response cost. We may also be subject to the corrective action provisions of the Resource, Conservation and Recovery Act, or RCRA, and analogous state laws that require owners and operators of facilities that treat, store, or dispose of hazardous waste to clean up releases of hazardous waste constituents into the environment associated with their operations
Many of our facilities and operations are also governed by laws and regulations relating to worker health and workplace safety, including the Federal Occupational Safety and Health Act, or OSHA. We believe that appropriate precautions are taken to protect our employees and others from harmful exposure to potentially hazardous work environments, and that we operate in substantial compliance with all OSHA and similar regulations.
We are also subject to laws and regulations related to conflict minerals, forced labor, export compliance, anti-corruption, and immigration and we have adopted policies, procedures and employee training programs that are designed to facilitate compliance with those laws and regulations.
Available Information
All periodic and current reports, registration statements, and other filings that we are required to make with the Securities and Exchange Commission (the “SEC”), including annual reports on Form 10-K, quarterly reports on Form 10-Q, current reports on Form 8-K, and amendments to those reports filed or furnished pursuant to Section 13(a) or 15(d) of the Securities Exchange Act of 1934, proxy statements and other information are available free of charge through our website as soon as reasonably practicable after we file them with, or furnish them to, the SEC. You may access and read our SEC filings free of charge through our website at ir.jbtmarel.com, under “SEC Filings,” or the SEC’s website at www.sec.gov.
Investors and others should note that we may announce material information to our investors using our investor relations website (ir.jbtmarel.com), SEC filings, press releases, public conference calls and webcasts. We use these channels, as well as social media, to communicate with our investors and the public about our Company, our business and other issues. It is possible that the information that we post on these channels could be deemed to be material information. We therefore encourage investors to visit these websites from time to time.
12
The information contained on or connected to our website, ir.jbtmarel.com, is not incorporated by reference into this Annual Report on Form 10-K or any other report we file with the SEC.
INFORMATION ABOUT OUR EXECUTIVE OFFICERS
The executive officers of JBT Marel Corporation, together with the offices currently held by them, their business experience and their ages as of February 23, 2026, are as follows:
| Name | Age | Office | ||||||||||||
| Brian A. Deck | 57 | Chief Executive Officer | ||||||||||||
| Matthew J. Meister | 47 | Executive Vice President and Chief Financial Officer | ||||||||||||
| Arni Sigurdsson | 42 | President | ||||||||||||
| Shelley Bridarolli | 55 | Executive Vice President, Chief Human Resources Officer | ||||||||||||
| James C. Pelletier | 48 | Executive Vice President, General Counsel and Secretary | ||||||||||||
| Luiz “Augusto” Rizzolo | 48 | Executive Vice President, Regions and Integration | ||||||||||||
| Roger Claessens | 50 | Executive Vice President and President, Poultry | ||||||||||||
| Robert Petrie | 56 | Executive Vice President and President, Meat and Prepared Foods | ||||||||||||
| Mary Beth Siddons | 62 | Executive Vice President and President, Diversified Food and Health | ||||||||||||
BRIAN A. DECK has been our Chief Executive Officer since December 2020 and served as President of JBT from December 2020 to January 2025. He was previously our interim Chief Executive Officer from June 2020 to December 2020. Mr. Deck served as our Vice President and Chief Financial Officer from February 2014 until December 2020.
MATTHEW J. MEISTER became our Chief Financial Officer in December 2020 after serving as the interim Chief Financial Officer since October 2020. Mr. Meister joined JBT in May 2019 as Vice President and CFO for JBT Protein, with responsibility for all accounting and finance activity for the Protein Division within the FoodTech segment.
ARNI SIGURDSSON was appointed as President of JBT Marel upon the closing of the Marel Transaction in January 2025. Prior to that, Mr. Sigurdsson served as Chief Executive Officer of Marel from December 2023, after leading Marel as Interim Chief Executive Officer from November of the same year. He took over the role of Chief Business Officer and Deputy Chief Executive Officer of Marel in November 2022, where he was responsible for Marel’s business divisions, in addition to the overall business growth and the strategic direction of Marel. Mr. Sigurdsson joined Marel in 2014 as Head of Strategy, before transitioning to the role of Chief Strategy Officer and Executive Vice President of Strategic Business Units from 2020 to 2022.
SHELLEY BRIDAROLLI became our Executive Vice President, Chief Human Resources Officer in September 2021. Prior to that, Ms. Bridarolli was the Senior Vice President Human Resources of Dana Incorporated from November 2018 until April 2021.
JAMES C. PELLETIER became our Executive Vice President, General Counsel and Secretary in June 2025. Previously, Mr. Pelletier served as General Counsel and Chief Compliance Officer of Kymera International, an advanced specialty materials manufacturer, from 2024 to 2025. He served as Senior Vice President, General Counsel and Corporate Secretary of Masonite International Corporation, a provider of interior and exterior doors and door systems, from 2022 to 2024, and as Senior Vice President, General Counsel and Secretary of Barnes Group Inc., a provider of highly engineered products and differentiated industrial technologies, from 2020 to 2022.
LUIZ “AUGUSTO” RIZZOLO became the Executive Vice President, Regions and Integration in January 2025 after serving as the Executive Vice President and President, Diversified Food and Health from October 2022 to January 2025. Previously, Mr. Rizzolo served as a President, Protein North America from 2020 through 2024.
ROGER CLAESSENS became our Executive Vice President, Poultry in January 2025, following the close of the Marel Transaction. He had previously served as the Executive Vice President Poultry at Marel since September 2019.
ROBERT PETRIE was appointed as our Executive Vice President and President, Protein in September 2021. Mr. Petrie previously led JBT’s Protein EMEA (Europe, Middle East, and Africa) business, with additional responsibility for JBT’s Protein business in Asia, from April 2019 to September 2021.
13
MARY BETH SIDDONS became our Executive Vice President and President of Diversified Food & Health in January 2025, following the close of the Marel Transaction. Previously, Ms. Siddons served as President of JBT Diversified Food & Health North America from January 2024 to January 2025 and President of JBT Processing Group from October 2022 to January 2024. Prior to joining JBT, Ms. Siddons was President of the Industrial Solutions Division at Spectris plc, a supplier of precision instrumentation and controls, from February 2021 to October 2022 and Sector President of Retail Solutions at Marmon Holdings from 2017 to 2019.
14
ITEM 1A. RISK FACTORS
You should carefully consider the risks described below, together with all of the other information included in this Annual Report on Form 10-K, in evaluating our company and our common stock. If any of the risks described below actually occurs, our business, financial condition, results of operations, cash flows and stock price could be materially adversely affected.
BUSINESS AND OPERATIONAL RISKS
Our financial results are subject to fluctuations caused by many factors that could result in our failing to achieve anticipated financial results and cause a drop in our stock price.
Our quarterly and annual financial results have varied in the past and are likely to continue to vary in the future due to a number of factors, many of which are beyond our control. In particular, the contractual terms and the number and size of orders in the capital goods industries in which we compete vary significantly over time. The timing of our sales cycle from receipt of orders to shipment of the products or provision of services can significantly impact our sales and income in any given fiscal period. These and any one or more of the factors listed below, among other things, could cause us not to achieve our revenue or profitability expectations in any given period and the resulting failure to meet such expectations could cause a drop in our stock price:
•volatility in demand for our products and services, including volatility in growth rates in the food processing industry;
•downturns in our customers’ businesses resulting from deteriorating domestic and international economies where our customers conduct substantial business;
•increases in commodity prices resulting in increased manufacturing costs, such as petroleum-based products, metals or other raw materials we use in significant quantities;
•supply chain delays and interruptions;
•effects of tight labor market on our labor costs resulting from higher labor turnover, shortage of skilled labor, and higher labor absenteeism;
•changes in pricing policies resulting from competitive pressures, including aggressive price discounting by our competitors and other market factors;
•our ability to develop and introduce on a timely basis new or enhanced versions of our products and services;
•unexpected needs for capital expenditures or other unanticipated expenses;
•changes in the mix of revenue attributable to domestic and international sales;
•changes in the mix of products and services that we sell;
•changes in foreign currency rates;
•seasonal fluctuations in buying patterns;
•future acquisitions and divestitures of technologies, products, and businesses;
•changes to trade regulation, quotas, duties or tariffs; and
•cyber-attacks and other IT threats that could disable our IT infrastructure and create a meaningful inability to operate our business.
The cumulative loss of several significant contracts may negatively affect our business, financial condition, results of operations, and cash flows.
We often enter into large, project-oriented contracts, or long-term equipment leases and service agreements. These agreements may be terminated or breached, or our customers may fail to renew these agreements. If we were to lose several significant agreements and if we were to fail to develop alternative business opportunities, then we could experience a material adverse effect on our business, financial condition, results of operations, and cash flows.
15
We may lose money or not achieve our expected profitability on fixed-price contracts.
As is customary for several of the business areas in which we operate, we may provide products and services under fixed-price contracts. Under such contracts, we are typically responsible for cost overruns. Our actual costs and any gross profit realized on these fixed-price contracts may vary from our estimates on which the pricing for such contracts was based. There are inherent risks and uncertainties in the estimation process, including those arising from unforeseen technical and logistical challenges or longer than expected lead times for sourcing raw materials and assemblies. A fixed-price contract may significantly limit or prohibit our ability to mitigate the impact of unanticipated increases in raw material prices (including the price of steel and other significant raw materials) by passing on such price increases. Depending on the volume of our work performed under fixed-price contracts at any one time and our ability to offset or pass through any cost increases under such contracts, cost overruns could have a material adverse impact on our business, financial condition, results of operations, and cash flows.
Infrastructure failures or catastrophic loss at any of our facilities, including damage or disruption to our information systems and information database, could lead to production and service curtailments or shutdowns and negatively affect our business, financial condition, results of operations, and cash flows.
We manufacture our products at facilities in the United States, Brazil, Belgium, China, Denmark, Germany, Iceland, India, Italy, Slovakia, Spain, Sweden, the Netherlands, and the United Kingdom. An interruption in production or service capabilities at any of our facilities as a result of equipment failure or any other reasons could result in our inability to manufacture our products. In the event of a stoppage in production at any of our facilities, even if only temporary, or if we experience delays as a result of events that are beyond our control, delivery times to our customers could be severely affected. Any significant delay in deliveries to our customers could lead to cancellations.
Our operations are also dependent on our ability to protect our facilities, computer equipment and the information stored in our databases from damage by, among other things, earthquake, fire, natural disaster, explosions, power loss, telecommunications failures, hurricane, and other catastrophic events. For instance, a part of our operations is based in an area of California that has experienced earthquakes and wildfires and other natural disasters, while another part of our operations is based in an area of Florida that has experienced hurricanes and other natural disasters.
Despite our best efforts at planning for such contingencies, catastrophic events of this nature may still result in delays in deliveries, catastrophic loss, system failures and other interruptions in our operations, which could have a material adverse effect on our business, financial condition, results of operations, and cash flows.
In addition, it is periodically necessary to replace, upgrade, or modify our internal information systems. For example, we are currently in the process of implementing common Enterprise Resource Planning (“ERP”), customer relationship management, and other information technology systems across the majority of our businesses. If we are unable to do this in a timely and cost-effective manner, especially in light of demands on our information technology resources, our business, financial condition, results of operations, and cash flows may be materially adversely impacted.
The loss of key personnel or any inability to attract and retain additional personnel could affect our ability to successfully grow our business.
Our performance is substantially dependent on the continued services and performance of our senior management and other key personnel. Our performance also depends on our ability to retain and motivate our officers and key employees. The loss of the services of any of our executive officers or other key employees for any reason could harm our business. Transitions in our senior executive management roles could adversely impact our strategic planning, specifically resulting in unexpected changes, or delays in the planning and execution of such plans and can cause a diversion of management time and attention.
Our results of operations can be adversely affected by labor shortages, turnover and labor cost increases.
We have from time-to-time experienced labor shortages and other labor-related issues. A number of factors may adversely affect the labor force available to us in one or more of our markets, including high employment levels, government unemployment subsidies, and other government regulations, which include laws and regulations related to workers’ health and safety, wage and hour practices and immigration. These factors can also impact the cost of labor. Increased turnover rates within our employee base can lead to decreased efficiency and increased costs, such as increased overtime to meet demand and increased wage rates to attract and retain employees. An overall labor shortage or lack of skilled labor, increased turnover, higher rates of absenteeism or labor inflation could have a material adverse effect on our results of operations. Our ability to maintain or increase our profitability is in part dependent on our ability to align our labor force with our production requirements. Whereas we seek to build in flexibility through the use of
16
overtime, double shifts and temporary workforce, we may fail to align our staffing with our production requirements, which would expose us to increased costs and negatively affect our profitability.
We rely on our ability to successfully grow our installed base through long-term customer relationships.
We depend on our ability to successfully grow our installed base through long-term customer relationships. Our initial contact with customers, including the design, delivery and installation of processing equipment, systems and software at customers’ facilities, establishes the basis for future business with those customers. Once a solution is installed and operational at a customer’s facility, that customer can become a valuable source of continuing demand for our aftermarket business and additional equipment business. Continuing demand for such equipment, systems, software and services depends on our ability to successfully deliver solutions based on customers’ needs and execute the initial installation in a timely and professional manner that encourages the customer to continue transacting with us in the future. Any failure or perceived shortcoming in the quality of the equipment or installation process may materially adversely affect the potentially larger revenues facilitated by long-term customer loyalty and negatively impact our ability to grow our installed base.
This risk is more pronounced with respect to greenfield and large projects. The initial installation of a greenfield or large project is frequently a large, complex project that entails a significant investment by the customer and may in certain instances involve a long lead time between when the order is received and the equipment becomes operational. We may face design and engineering challenges due to the features of the customer’s operations or facilities or unforeseen obstacles to delivery and installation. In addition, any failure to deliver high quality products and service in line with the customer’s needs and expectations throughout the product development and installation process may impair our ability to secure revenues generated by maintenance, service (provided on an ad hoc basis or service level agreements) and aftermarket parts.
Moreover, if we fail for any reason to deliver a solution in line with the needs and expectations of our customers, our costs may rise if we are required to re-design or otherwise bear the risk of unforeseen delays or costs. If we fail to recoup such costs, our profit margins may deteriorate. In addition, if the quality of an installation is sub-par or not responsive to the customer’s needs, our reputation as a quality brand may suffer. Any of these failures could impair our ability to grow our installed base, which could have a material adverse effect on our business, results of operations and financial condition.
We earn a significant amount of aftermarket revenues. If we are unable to maintain the size and reliability of this part of our business, our business, results of operations and financial condition may be materially adversely affected.
Much of our total revenues are attributable to our aftermarket business, covering service, maintenance and spare parts. Because our customers rely on high throughput requirements and deal with highly perishable goods, our ability to deliver prompt and timely service is essential to our aftermarket business. Therefore, any failure to meet quality requirements, maintain sufficient inventories of spare parts or otherwise timely meet customer demands for service, maintenance or spare parts could have a material adverse effect on our business, results of operations and financial condition. Moreover, the number of specialized service or spare parts providers, with a business strategy built around servicing our equipment at a lower cost than ours, could increase. Any substantial increase in the number of competitors could erode our aftermarket business or overall market share, which could have a material adverse effect on our business, results of operations and financial condition.
Our manufacturing, distribution and service and maintenance activities are subject to health and safety risks.
Our manufacturing, distribution, service and maintenance activities involve the use of industrial machinery to produce, assemble, maintain, and service its processing equipment and systems. Employees interacting with such machinery may be injured, or incur long-term medical costs as a result of other aspects of the work environment, which injury or costs could result in legal liability or increased personnel costs for us. Such liabilities, if severe enough, could increase our costs or tarnish our reputation, either of which could have a material adverse effect on our business, results of operations and financial condition.
Our Russian operations have been and may continue to be affected by Russia’s invasion of Ukraine and related sanctions imposed in response, and we may in the future choose or be required to further limit or shut down those operations entirely.
We continue to conduct business in Russia through a wholly-owned subsidiary in Russia and provide services and spare parts to Russian customers under existing service level agreements and finalized outstanding Russian projects, as permitted under applicable U.S. and EU sanctions.
We may face risks associated with maintaining a subsidiary in Russia, or with any international operations in Russia or Belarus, including risks associated with our compliance with evolving international sanctions, potential reputational harm as a result of operations in Russia or Belarus, and challenges with international transfers of funds held in Russia. While we have policies and procedures in place designed to ensure compliance with applicable sanctions and trade restrictions, our employees or agents may take
17
actions in violation of such policies and applicable law, and we could be held ultimately responsible. If we are held responsible for a violation of U.S. or EU sanctions laws, we may be subject to various penalties, any of which could have a material adverse effect on our business, financial condition or results of operations. In addition, we may in the future choose or be required to further limit or cease operations in Russia and/or Belarus entirely, in which case we will no longer receive revenue from those operations. We could also incur expenses as a result of the process of shutting down operations in Russia.
Material weaknesses were identified in Marel’s internal control over financial reporting and we may identify additional material weaknesses in the future or fail to maintain an effective system of internal control over financial reporting, which could result in material misstatements of Marel’s accounts and disclosures.
Prior to the acquisition, Marel was not subject to the information and reporting requirements of the Exchange Act, the Sarbanes-Oxley Act or other U.S. federal securities laws, including the compliance obligations relating to, among other things, the maintenance of a system of internal controls as contemplated by the Exchange Act and the Sarbanes-Oxley Act. We need to timely and effectively design and implement controls and procedures over Marel’s operations necessary to satisfy those requirements. We intend to take appropriate measures to design and implement internal controls at Marel aimed at successfully fulfilling these requirements on the timeline allowed by the rules of the Securities and Exchange Commission. However, it is possible that we may experience delays in implementing the appropriate internal controls and procedures relating to Marel's operations, which could result in increased costs, enforcement actions, the assessment of penalties and civil suits, failure to meet reporting obligations and other material and adverse events that could have a negative effect on our operations.
As discussed in Item 9A., prior to the acquisition of Marel, its management identified two material weaknesses in its internal control over financial reporting, which remained unremediated as of December 31, 2025. Specifically, its management identified that 1) Marel did not design and maintain effective information technology general controls for information systems that are relevant to financial reporting. Specifically, Marel did not design and maintain: (i) program change management controls to ensure that information technology program and data changes are identified, tested, authorized, and implemented appropriately; (ii) user access controls to ensure appropriate segregation of duties and to adequately restrict user and privileged access to appropriate personnel; (iii) computer operations controls to ensure that processing and transfer of data, and data backups and recovery are monitored; and (iv) program development controls to ensure that new software development is tested, authorized and implemented appropriately. These IT deficiencies did not result in a material misstatement to the financial statements, however, the deficiencies, when aggregated, could impact maintaining effective segregation of duties, as well as the effectiveness of IT-dependent controls (such as automated controls that address the risk of material misstatement to one or more assertions, along with the IT controls and underlying data that support the effectiveness of system-generated data and reports) that could result in misstatements potentially impacting all financial statement accounts and disclosures that would not be prevented or detected, and 2) Marel did not design or maintain effective controls over the recording and review of journal entries for validity, accuracy, and completeness. Specifically, certain key accounting personnel have the ability to prepare and post journal entries without an appropriately designed independent review. This material weakness did not result in a material misstatement to the financial statements; however, it could result in a potential misstatement of Marel’s accounts or disclosures that could result in a material misstatement to the annual or interim consolidated financial statements that would not be prevented or detected. If we experience a delay in successfully remediating any identified control deficiencies, including current or future material weaknesses in our internal control over financial reporting, the accuracy and timing of our financial reporting may be adversely affected; our liquidity, access to capital markets and perceptions of our creditworthiness may be adversely affected; we could face difficulty forecasting our financial results accurately, impacting decision-making by investors and analysts; we may be unable to maintain compliance with securities laws, stock exchange listing requirements and debt instruments’ covenants regarding the timely filing of periodic reports; we may be subject to regulatory investigations and penalties; investors may lose confidence in our financial reporting; we may suffer defaults under our debt instruments; and our common stock price may decline.
Further, as discussed in Item 9A., we have and may continue to discover weaknesses in Marel’s system of internal control over financial reporting that could result in a material misstatement of Marel’s accounts and disclosures. Our internal control over financial reporting may not prevent or detect all errors and all fraud. A control system, no matter how well designed and operated, can provide only reasonable, not absolute, assurance that the control system’s objectives will be met. Because of the inherent limitations in all control systems, no evaluation of controls can provide absolute assurance that misstatements due to error or fraud will not occur or that all control issues and instances of fraud will be detected.
18
INDUSTRY RISKS
Deterioration of economic conditions could adversely impact our business.
Our business may be adversely affected by changes in current or future national or global economic conditions, including lower growth rates or recession, high unemployment, rising interest rates, limited availability of capital, decreases in consumer spending rates, the availability and cost of energy, tightening of government monetary policies to contain inflation and the effect of government deficit reduction, sequestration, and other austerity measures impacting the markets we serve. Any such changes could adversely affect the demand for our products or the cost and availability of our required raw materials, which can have a material adverse effect on our financial results. Adverse national and global economic conditions could, among other things:
•make it more difficult or costly for us to obtain necessary financing for our operations, our investments and our acquisitions, or to refinance our debt;
•cause our lenders or other financial instrument counterparties to be unable to honor their commitments or otherwise default under our financing arrangements;
•impair the financial condition of some of our customers, thereby hindering our customers’ ability to obtain financing to purchase our products and/or increasing customer bad debts;
•cause customers to forgo or postpone new purchases in favor of repairing existing equipment and machinery, and delay or reduce preventative maintenance, thereby reducing our revenue and/or profits, including by impeding growth in aftermarket revenue opportunities in the longer term;
•negatively impact our customers’ ability to raise pricing to counteract increased fuel, labor, and other costs, making it less likely that they will expend the same capital and other resources on our equipment as they have in the past;
•impair the financial condition of some of our suppliers thereby potentially increasing both the likelihood of our having to renegotiate supply terms on terms that may not be as favorable to us and the risk of non-performance by suppliers;
•negatively impact global demand for technologically sophisticated food production equipment, which could result in a reduction of sales, operating income, and cash flows;
•negatively affect the rates of expansion, consolidation, renovation, and equipment replacement within the food processing industry, which may adversely affect the results of operations of our business; and
•impair the financial viability of our insurers.
In addition, our profitability may be adversely affected during any periods of unexpected or rapid increases in interest rates on our variable rate debt. We have taken steps to mitigate; however, a significant increase in interest rates may significantly increase our cost of borrowings and reduce the availability and increase the cost of obtaining new debt and refinancing existing indebtedness. For additional detail related to this risk, see Part II, Item 7A, “Quantitative and Qualitative Disclosure About Market Risk.”
Variability in the length of our sales cycles makes accurate estimation of our revenue in any single period difficult and can result in significant fluctuation in quarterly operating results.
The length of our sales cycle varies depending on a number of factors over which we may have little or no control, including the size and complexity of a potential transaction, the level of competition that we encounter during our selling process, and our current and potential customers’ internal budgeting and approval processes. Many of our sales are subject to an extended sales cycle. As a result, we may expend significant effort and resources over long periods of time in an attempt to obtain an order, but ultimately not obtain the order, or obtain an order that is smaller than we anticipated. Revenue generated by any one of our customers may vary from quarter to quarter, and a customer who places a large order in one quarter may generate significantly lower revenue in subsequent quarters. Due to the length and uncertainty of our sales cycle, and the variability of orders from period to period, we believe that quarter-to-quarter comparisons of our revenue and operating results may not be an accurate indicator of our future performance.
19
Our inability to secure raw material supply, component parts, sub-assemblies, finished good assemblies, installation labor, and/or logistics capacity in a timely and cost-effective manner from suppliers would adversely affect our ability to manufacture, install and/or distribute products to customers.
We purchase raw materials, component parts, sub-assemblies, and/or finished good assemblies for use in manufacturing, installation, service and/or distribution of our products to customers. Logistics availability and other external factors impacting our inbound and outbound transportation, raw material supply, component parts, sub-assemblies, and/or finished goods we procure could result in manufacturing, installation and/or outbound transportation delays, inefficiencies, or our inability to distribute products if we cannot timely and efficiently manufacture them. In addition, our gross margins could be adversely impacted if raw materials, component parts, sub-assemblies, finished goods, installation services and/or logistics provider’s higher costs cannot be offset with timely pricing increases to customers.
The disruptions to the global economy as a result of recent and ongoing geopolitical events continue to impede global supply chains, resulting in longer lead times and increased raw material costs. We have taken steps to minimize the impact of these increased costs by working closely with our suppliers and customers. Despite the actions we have taken to minimize the impacts of supply chain disruptions, there can be no assurances that unforeseen future events in the global supply chain and inflationary pressures will not have a material adverse effect on our business, financial condition and results of operations.
An increase in energy or raw material prices may reduce the profitability of our customers, which ultimately could negatively affect our business, financial condition, results of operations, and cash flows.
Energy prices are volatile globally, but are especially high in Europe, as a result of the war in the Ukraine. High energy prices have a negative trickledown effect on our customers’ business operations by reducing their profitability because of increased operating costs. Our customers require large amounts of energy to run their businesses and higher energy prices also increase food processors’ operating costs through increased energy and utility costs to run their plants, higher priced chemical and petroleum based raw materials used in food processing, and higher fuel costs to run their logistics and service fleet vehicles.
Food processors are also affected by the cost and availability of raw materials such as feed grains, livestock, produce, and dairy products. Increases in the cost and limitations in the availability of such raw materials can negatively affect the profitability of food processors’ operations.
Any reduction in our customers’ profitability due to higher energy or raw material costs or otherwise may reduce their future expenditures for the food processing equipment that we provide. This reduction may have a material adverse effect on our business, financial condition, results of operations, and cash flows.
Changes in food consumption patterns, regulatory developments or economic conditions may reduce demand for our products and adversely affect our business, financial condition, results of operations, and cash flows.
Dietary trends and changes in the regulatory environment can impact the demand for food products. For example, dietary trends and regulatory developments can create demand for protein food products but negatively impact demand for high-carbohydrate foods, or create demand for easy to prepare, transportable meals but negatively impact traditional canned food products. Because different food types and food packaging can quickly go in and out of style as a function of dietary, health, convenience, or sustainability trends, food processors can be challenged in accurately forecasting their needed manufacturing capacity. Rising food and other input costs, and recessionary fears may also negatively impact our customers’ ability to forecast consumer demand for protein products or processed food products. Fluctuations in supply and demand can decrease the wholesale prices of food products, which can impact the profitability of our customers.
In addition, our customers’ operations are subject to extensive regulations, including those that relate to animal welfare, food safety, and the processing, packaging, and storage of food products. These regulations could become more restrictive, which could lead to increased costs for our customers, or could require our customers to change their processes. If we are unable to timely modify or create new products that comply with regulatory requirements at attractive prices, demand for our products could fall.
Consumer demand uncertainty, reduced customer profitability, or changes to regulatory requirements may impair our customers’ interest in or ability to invest in equipment and services, and as a result negatively impact our customer’s demand for our goods and services, which could have a material adverse effect on our business, financial condition, results of operations, and cash flows.
20
Freezes, hurricanes, droughts, other natural disasters, adverse weather conditions, outbreak of animal borne diseases (H5N1, BSE, or other virus strains affecting poultry or livestock), citrus tree diseases, or food borne illnesses or other food safety, or quality concerns may negatively affect our business, financial condition, results of operations, and cash flows.
An outbreak or pandemic stemming from H5N1 (avian flu), BSE (mad cow disease), African swine fever (pork) or any other animal related disease strains could reduce the availability of poultry or beef that is processed for restaurant, food service, wholesale or retail consumers. Any limitation on the availability of such raw materials could discourage food producers from making additional capital investments in processing equipment, aftermarket products, parts, and services that we provide. Such a decrease in demand for our products could have a material adverse effect on our business, financial condition, results of operations, and cash flows.
The success of our business that serves the citrus food processing industry is directly related to the viability and health of citrus crops. The citrus industries in Florida, Brazil, and other countries are facing increased pressure on their harvest productivity and citrus bearing acreage due to citrus canker and greening diseases. These citrus tree diseases are often incurable once a tree has been infested and the end result can be the destruction of the tree. Reduced amounts of available fruit for the processed or fresh food markets could materially adversely affect our business, financial condition, results of operations, and cash flows.
In the event an E. coli or other food borne illness causes a recall of meat or produce, the companies supplying fresh, further processed or packaged forms of those products could be severely adversely affected. Any negative impact on the financial viability of our fresh or processed food provider customers could adversely affect our immediate and recurring revenue base. We also face the risk of liabilities associated with product recalls to the extent that our products are determined to have caused an issue leading to a recall.
In the event a natural disaster negatively affects growers or farm production, the food processing industry may not have the fresh food raw materials necessary to meet consumer demand. Crops or entire groves or fields can be severely damaged by a drought, flood, freeze, or hurricane, wildfires or adverse weather conditions, including the effects of climate change. An extended drought or freeze or a high category hurricane could permanently damage or destroy a tree crop area. If orchards have to be replanted, trees may not produce viable product for several years. Since our recurring revenue is dependent on growers’ and farmers’ ability to provide high quality crops, poultry or livestock to certain of our customers, our business, financial condition, results of operations, and cash flows could be materially adversely impacted in the event of a freeze, hurricane, drought, or other natural disaster.
Customer sourcing initiatives may adversely affect our new equipment and aftermarket businesses.
Many multi-national companies, including our customers and prospective customers, have undertaken supply chain integration initiatives to provide a sustainable competitive advantage against their competitors. Under continued price pressure from consumers, wholesalers and retailers, our manufacturer customers are focused on controlling and reducing cost, enhancing their sourcing processes, and improving their profitability.
A key value proposition of our equipment and services is low total cost of ownership. If our customers implement sourcing initiatives that focus solely on immediate cost savings and not on total cost of ownership, our new equipment and aftermarket sales could be adversely affected.
Our business could suffer in the event of a work stoppage by our unionized or non-union labor force.
Outside the United States, we enter into employment contracts and agreements in certain countries in which national employee work councils are mandatory or customary, such as in Belgium, Denmark, Germany, Iceland, Italy, the Netherlands, Spain, and Sweden.
Any future strikes, employee slowdowns, or similar actions by one or more work councils, in connection with labor contract negotiations or otherwise, could have a material adverse effect on our ability to operate our business. Alternatively, a successful campaign by our unionized workforce could result in higher personnel costs or diminished productivity in our manufacturing sites. Even an unsuccessful union campaign could divert management time and energy away from routine operational priorities. Any of these factors may adversely impact our operations, cause us to incur incremental costs and/or damage our reputation.
We may also be subject to general country strikes or work stoppages unrelated to our business or collective bargaining agreements, which could result in operational delays or other adverse impacts on production. A work stoppage or other limitations on production at our facilities for any reason could have an adverse effect on our business, results of operations and financial condition. In addition, many of our customers and suppliers have unionized work forces. Strikes or work stoppages experienced by our customers or suppliers could have a material adverse effect on our business, results of operations and financial condition.
21
If we cannot compete effectively, our business could be adversely affected.
Across our operating segments, we operate in highly competitive markets. We compete across the primary, secondary and further food processing sectors. We compete with numerous multinational, regional and local processing equipment providers of various sizes and cost structures. The primary processing sector is relatively concentrated, and we compete with a small number of key global participants in each segment focused on serving animal protein processing. Competition within primary processing is strong, with product pricing being a key competitive factor.
The secondary and further processing sectors are highly fragmented and we face strong competition. However, only a limited number of competitors are international full-line providers across primary, secondary and further processing. There are also a number of regional and local food processing equipment suppliers, but only a limited number of competitors cover a significant part of the value chain. In addition, we compete within secondary and further processing with large-scale industry-agnostic providers of industrial equipment, some of which may have substantially greater financial and other resources than us.
Existing or new competitors may develop their current products and technologies further or create alternative ones that are more attractively priced, offer higher quality or are more appealing for other reasons than our products. If new or better developed products can be offered at more attractive prices, or if such products are more attractive than our products for other reasons (such as a higher degree of functionality or improved ability to avoid production stoppages and downtime or a higher degree of quality control and value chain integration), demand for our products could fall or we may be required to lower our prices, which could have a material adverse effect on our business, results of operations and financial condition.
LEGAL AND REGULATORY RISKS
Disruptions in the political, regulatory, economic and social conditions of the countries in which we conduct business could negatively affect our business, financial condition, and results of operations.
We operate manufacturing facilities in many countries other than the United States, the largest of which are located in Brazil, Belgium, China, Denmark, Germany, Iceland, India, Italy, Slovakia, Spain, Sweden, the Netherlands, and the United Kingdom. International sales accounted for 62% of our 2025 revenue. Multiple factors relating to our international operations and to those particular countries in which we operate or seek to expand our operations could have an adverse effect on our financial condition or results of operations. These factors include, among others:
•economic downturns, inflationary and recessionary markets, including in capital and equity markets;
•civil unrest, political instability, terrorist attacks, and wars;
•nationalization, expropriation, or seizure of assets;
•potentially unfavorable tax law changes;
•inability to repatriate income or capital;
•foreign ownership restrictions;
•export regulations that could erode profit margins or restrict exports, including import or export licensing regulations;
•trade policies, including the imposition of tariffs or other trade restrictions, and other trade protection measures, or price controls;
•restrictions on operations, trade practices, trade partners, and investment decisions resulting from domestic and foreign laws and regulations;
•compliance with the U.S. Foreign Corrupt Practices Act and other similar laws;
•burden and cost of complying with different national and local laws, treaties, and technical standards and changes in those regulations;
•transportation delays and interruptions; and
•reductions in the availability of qualified personnel.
Our business has been, and may continue to be, adversely affected by tariffs, trade sanctions or similar government actions, as well as overall uncertainty surrounding international trade relations.
Our operations in various countries and jurisdictions subject us to the legal, political, regulatory, and social requirements and economic conditions in these jurisdictions. The imposition by the United States of tariffs, sanctions or other restrictions on goods exported from the United States or imported into the United States, and countermeasures imposed in response to such actions, have introduced uncertainty in the market and increased the cost of goods for our products and could reduce our ability to sell our products globally, which may adversely affect our operating results and financial condition. The materials subject to these tariffs or proposed tariffs have impacted the cost and availability of raw materials used by our suppliers or in our customers’ products. We may not be able to fully mitigate the impact of these increased costs or pass price increases on to our customers. The situation around tariffs is
22
fluid and we cannot predict further developments, and any existing or future tariffs could have a material adverse effect on our results of operations, financial position and cash flows.
Additionally, the imposition of further tariffs by the United States on a broader range of imports, or further retaliatory trade measures taken by other countries’ governments in response to additional tariffs imposed by the United States, could increase costs in our supply chain, which may cause us to increase prices in certain markets in order to mitigate the impact of these trade-related increases on our costs of products sold, and reduce demand for our and/or our customers’ products, either of which could adversely affect our results of operations. Any increase in trade-related costs associated with such measures may impair the profitability of our international production, may strain our suppliers’ ability to reliably provide inputs necessary to produce our products, and may otherwise affect our ability to provide our products at previously contracted prices. We may, over the longer term, make changes in our supply chain and our global manufacturing strategy to mitigate the negative impacts of changing U.S. and foreign trade policies, which may not be successful. Tariffs may also indirectly impair our business by causing a negative effect on global economic conditions and financial markets. The ultimate impact of these trade measures on our business operations and financial results is uncertain and may be affected by various factors, including whether and when such trade measures are implemented, the timing when such measures may become effective, and the amount, scope, or nature of such trade measures, and our ability to execute strategies to mitigate the negative impacts. Our inability to effectively manage the negative impacts of changing U.S. and foreign trade policies could materially adversely impact our results of operations, financial conditions and cash flows.
From time to time we may be a party to litigation and investigations, which may require significant management time and attention and result in significant legal expenses.
We are and may in the future be subject to a variety of claims, litigation, investigations, proceedings, and other matters, as well as tax and other legal compliance risks. These claims may relate to the environment, health and safety, employee benefits, import and export compliance, intellectual property, product liability, tax matters, securities regulation, regulatory compliance, our operations, contractual matters and other disputes. We may also file lawsuits and take other legal actions to protect our intellectual property and/or any unlawful practices. In addition, our operations and industries are subject to a variety of U.S. and international laws, which can change. We therefore face uncertainties with regard to lawsuits, regulations, and other related matters. From time to time, investigations into aspects of our business may include inquiries, subpoenas, and other types of information demands from government and regulatory authorities.Further, we may be exposed to litigation from stockholders, customers, partners, suppliers, contractors and other third parties. Such litigation or an adverse judgment resulting in monetary damages may have an adverse impact on our business, results of operations, financial condition and cash flows. Even if such lawsuits are without merit, defending against these claims can result in substantial costs and affect our results of operations, divert management time and attention, negatively impact our reputation or require us to recognize substantial charges to resolve.
The industries in which we operate expose us to potential liabilities arising out of the installation or use of our systems that could negatively affect our business, financial condition, results of operations, and cash flows.
Our equipment, systems and services create potential exposure for us for personal injury, wrongful death, product liability, commercial claims, product recalls, business interruption, production loss, property damage, pollution, and other environmental damages. In the event that a customer who purchases our equipment becomes subject to claims relating to food borne illnesses or other food safety or quality issues relating to food processed through the use of our equipment, we could be exposed to significant claims from our customers. Although we have obtained business and related risk insurance, we cannot assure you that our insurance will be adequate to cover all potential liabilities. Further, we cannot assure you that insurance will generally be available in the future or, if available, that premiums to obtain such insurance will be commercially reasonable. If we incur substantial liability and damages arising from such liability are not covered by insurance or are in excess of policy limits, or if we were to incur liability at a time when we are not able to obtain liability insurance, our business, financial condition, results of operations, and cash flows could be materially adversely affected.
Climate change and climate change legislation or regulations may adversely affect our business, financial condition, results of operations, and cash flows.
Continued attention to climate change, including societal, consumer and investor expectations on companies to address climate change and changes in consumer preferences may result in increased costs, reduced demand for our products and the products of our customers, reduced profits, risks associated with new legislative or regulatory requirements, risks to our reputation and the potential for increased litigation and governmental investigations. Foreign, federal, state and local regulatory and legislative bodies have proposed and some are implementing various legislative and regulatory measures relating to increased transparency and standardization of reporting related to factors that may be contributing to climate change, regulating GHG emissions, and energy policies. The enactment of such legislation or regulations could increase energy, environmental, compliance and other costs and we may need to make capital expenditures to comply with these legislative and regulatory requirements. Failure to comply with these
23
regulations could result in monetary penalties and could adversely affect our business, reputation, financial condition, results of operations and cash flows.
Investor and public perception related to our sustainability performance as well as current and future sustainability reporting requirements may affect our business and our operating results.
Companies across all industries are facing increasing scrutiny from a variety of stakeholders, including customers, investors, lenders and employees, relating to their environmental, social and governance and sustainability practices. Stakeholder focus on sustainability issues related to our industry requires continuous monitoring of various and evolving standards and expectations and any associated reporting requirements. If we fail to adequately meet or adapt to stakeholder expectations as they continue to evolve, or if we are perceived to have not responded appropriately or quickly enough to growing concern for sustainability issues, regardless of whether there is a regulatory or legal requirement to do so, we may face increased litigation risk, reputational damage, loss of business, diluted market valuation, and an inability to attract and retain customers and employees.
From time to time, in alignment with our sustainability strategy, we may establish and publicly announce climate-related goals. If we fail or are perceived to fail to achieve or improperly report on our progress toward achieving our sustainability goals and commitments, the resulting negative publicity could adversely affect our business, financial condition, results of operations, reputation and our access to capital. In addition, our continuing efforts to research, establish, accomplish and accurately report on the implementation of our sustainability strategy may also create additional operational risks and expenses and expose us to reputational, legal and other risks. While we create and publish voluntary disclosures regarding sustainability matters from time to time, some of the statements in those voluntary disclosures may be based on hypothetical expectations and assumptions that may or may not be representative of current or actual risks or events or forecasts of expected risks or events, including the costs associated therewith. Such expectations and assumptions are necessarily uncertain and may be prone to error or subject to misinterpretation given the long timelines involved and the lack of an established single approach to identifying, measuring and reporting on many sustainability matters.
Our voluntary disclosures of sustainability data are evaluated and rated by various organizations that assess corporate sustainability performance. These organizations provide information to investors on corporate governance and related matters and have developed ratings processes for evaluating companies on their approach to sustainability matters. Unfavorable sustainability ratings, or our inability to meet the sustainability standards set by specific investors, may lead to negative investor sentiment and reputational damage, which could have an adverse impact, among other things, on our stock price and cost of capital.
Further, our business and growth opportunities require us to have strong relationships with various key stakeholders, including our investors, employees, suppliers, customers and others. We may face pressures from stakeholders, many of whom are increasingly focused on climate change, to prioritize sustainable energy practices and carbon reduction initiatives in addition to our business objectives. At the same time, stakeholders and regulators have increasingly expressed or pursued divergent and evolving views, legislation and investment expectations with respect to sustainability, including the enactment or proposal of “anti-ESG” legislation or policies. We may also face negative impacts from consumers who do not support climate-related initiatives or concerns. If we do not successfully manage expectations across these varied stakeholder interests, it could erode our stakeholder trust and thereby affect our brand and reputation. Such erosion of confidence could negatively impact our business through decreased demand and growth opportunities, adverse publicity, difficulty hiring and retaining top talent, difficulty obtaining necessary approvals and permits from governments and regulatory agencies and difficulty securing investors and access to debt or capital.
We could be adversely affected by violations of the U.S. Foreign Corrupt Practices Act and similar worldwide anti-bribery laws.
The U.S. Foreign Corrupt Practices Act (“FCPA”), the U.K. Bribery Act of 2010 (the “U.K. Bribery Act”), and similar anti-bribery laws in other jurisdictions generally prohibit companies and their intermediaries from making improper payments for the purpose of obtaining or retaining business. Our policies mandate compliance with these anti-bribery laws. We operate in many parts of the world that have experienced governmental corruption to some degree and, in certain circumstances, strict compliance with anti-bribery laws may conflict with local customs and practices. Despite our training and compliance programs, there is no assurance that our internal control policies and procedures will protect us from acts committed by our employees or agents. If we are found to be liable for FCPA, U.K. Bribery Act or other similar violations (either due to our own acts, or due to the acts of others), we could suffer from civil and criminal penalties or other sanctions as well as reputational damage, which could have a material adverse impact on our business, financial condition, and results of operations.
Unfavorable tax law changes and tax authority rulings may adversely affect results.
We are subject to income taxes in the United States and various other foreign jurisdictions. Domestic and international tax liabilities are subject to the allocation of income among various tax jurisdictions. Our effective tax rate could be adversely affected by changes in the geographic mix of earnings. In addition, taxing authorities may enact significant changes to the taxation of business entities
24
including, among others, an increase in the corporate income tax rate, elimination of certain exemptions, and the imposition of minimum taxes or surtaxes on certain types of income. The likelihood of these changes or any other changes in tax law being enacted or implemented is unclear. Any such changes in tax laws where we have significant operations could materially affect our effective tax rate and our deferred tax assets and liabilities.
Although we believe our tax estimates are reasonable, we are subject to audit by tax authorities and the final determination of audits could be materially different from our historical tax provisions and accruals.
BUSINESS STRATEGY RISKS
We face risks associated with acquisitions.
To achieve our strategic objectives, we have pursued and expect to continue to pursue expansion opportunities such as acquiring other businesses or assets. Expanding through acquisitions involves risks such as:
•the incurrence of additional debt to finance the acquisition or expansion;
•additional liabilities (whether known or unknown), including, among others, product, environmental or pension liabilities of the acquired business or assets;
•our inability to perform comprehensive due diligence as a result of market factors related to the nature of an acquisition transaction, such as limitations that exist in public-company acquisitions or in competitive scenarios where time to perform due diligence is limited, and our consequent inability to identify information that may impact the valuation of an acquired business;
•risks and costs associated with integrating the acquired business or new operating facility into our operations;
•a failure to retain and assimilate key employees of the acquired business or assets;
•unanticipated demands on our management, operational resources and financial and internal control systems;
•unanticipated regulatory risks;
•the risk of being denied the necessary licenses, permits and approvals from state, local and foreign governments, and the costs and time associated with obtaining such licenses, permits and approvals;
•risks that we do not achieve anticipated operating efficiencies, synergies and economies of scale;
•risks in retaining the existing customers and contracts of the acquired business or assets; and.
•risk that unforeseen issues with an acquisition may adversely affect the anticipated results of the business or value of the intangible assets and trigger an evaluation of the recoverability of the recorded goodwill and intangible assets for such business.
If we are unable to effectively integrate acquired businesses or newly formed operations, or if such acquired businesses underperform relative to our expectations, this may have a material adverse effect on our business, financial position, and results of operations.
We may not realize some or all of the expected benefits and synergies from the Marel Transaction or do so within the intended timeframe and the integration costs may exceed estimates.
On January 2, 2025, we closed the voluntary takeover offer for all of the issued and outstanding shares of Marel. The success of the Marel Transaction will depend, in part, on our ability to realize the anticipated benefits from combining JBT and Marel’s businesses. We have and continue to devote substantial management attention and resources to the integration of the combined company’s business practices and operations so that we can fully realize the anticipated benefits of the Marel Transaction, including cost and revenue synergies. Nonetheless, difficulties may arise during the integration process that could result in the failure to realize the anticipated benefits and synergies and could have an adverse effect on our business, results of operations, financial condition or cash flows. For example, we may use more cash or other financial resources on integration and implementation activities than anticipated, and unanticipated increases in expenses unrelated to the Marel Transaction may offset the expected cost savings and other synergies from the Marel Transaction.
25
We have invested substantial resources in certain markets and strategic initiatives where we expect growth, and our business may suffer if we are unable to achieve the growth we expect.
As part of our strategy to grow, we are expanding our operations in certain emerging or developing markets, and accordingly have made and expect to continue to make investments to support anticipated growth in those regions. We may fail to realize expected rates of return on our existing investments or incur losses on such investments, and we may be unable to redeploy capital to take advantage of other markets, business lines or other potential areas of growth. Our results will also suffer if these developing markets, business lines or capabilities do not grow as quickly as we anticipate.
TECHNOLOGY RISKS
To remain competitive, we need to rapidly and successfully develop and introduce complex new solutions in a global, competitive, demanding, and changing environment.
The industries in which we participate are constantly undergoing development and change, and it is likely that new products, equipment, and service methods will be introduced in the future. If we lose our significant technology advantage in our products and services, our market share and growth could be materially adversely affected. In addition, if we are unable to deliver products, features, and functionality as projected, we may be unable to meet our commitments to customers, which could have a material adverse effect on our reputation and business. We may need to make significant expenditures to purchase new equipment, develop digital solutions, and to train our employees to keep pace with any new technological developments and market. These expenditures could adversely affect our results of operations and financial condition. In addition, significant investments in research and development efforts that do not lead to successful products, features, and functionality, could also materially adversely affect our business, financial condition, and results of operations.
Our product offerings include a subscription-based digital solutions. There is some uncertainty in the pace and depth of market acceptance of digital solutions in this industry. Our efforts in development and deployment of our software solutions, may also divert resources and management attention from other areas of our business. We expect to continue making significant investments to support these efforts, and our ability to support these efforts is dependent on generating sufficient profits from other areas of our business. Any failure to continue to further develop and update our software solutions, including with respect to the user experience and system installations and upgrades, could have a material adverse effect on our business, results of operations and financial condition. Any malfunctioning, cybersecurity breach or other failure of our embedded software solutions could result in customers attempting to hold us liable for losses, or increased costs or other penalties that they may incur in the event of a software malfunction or breach. Such claims could harm our customer relations and tarnish our reputation, which could have a material adverse effect on our business, results of operations and financial condition.
Our business, financial condition, results of operations, and cash flows could be materially adversely affected by competing technology. Some of our competitors are large multinational companies that may have greater financial resources than us, and they may be able to devote greater resources to research and development of new systems, services, and technologies than we are able to do. Moreover, some of our competitors operate in narrow business areas, allowing them to concentrate their research and development efforts more directly on products and services for those areas than we may be able to.
Our future growth is dependent on our ability to keep pace with the adoption of generative artificial intelligence and other machine learning technologies to remain competitive.
Our industry is marked by rapid technological developments and innovations, such as the use of artificial intelligence and machine learning, to conform to evolving industry standards. We may be required to make significant investments in artificial intelligence to maintain our competitive position in the market. If we are unable to provide enhancements and new features and integrations for our existing product portfolio, develop new products that achieve market acceptance, or innovate quickly enough to keep pace with these rapid technological developments, our business could be harmed. In addition, our customers could use artificial intelligence to develop digital tools that compete with our software solutions and adversely impact our business. Furthermore, the technical challenges associated with developing this technology may be significant, leading to risk of equipment failures, customer disruptions, or vulnerabilities that could compromise the integrity, security, or privacy of certain customer information. These failures could result in reputational damage, legal liabilities, or loss in customer confidence.
High-capacity products or products with new technology may be more likely to experience reliability, quality, or operability problems.
26
Even with rigorous testing prior to release and investment in product quality processes, problems may be found in newly developed or enhanced products after such products are launched and shipped to customers. Resolution of such issues may cause project delays, additional development costs, and deferred or lost revenue.
New products and enhancements of our existing products may also reduce demand for our existing products or could delay purchases by customers who instead decide to wait for our new or enhanced products. Difficulties that arise in our managing the transition from our older products to our new or enhanced products could result in additional costs and deferred or lost revenue.
If we are unable to develop, preserve, and protect our intellectual property assets, our business, financial condition, results of operations, and cash flows may be negatively affected.
We strive to protect and enhance our proprietary intellectual property rights through patent, copyright, trademark, and trade secret laws, as well as through technological safeguards and operating policies and procedures. It may be costly and time consuming to protect our intellectual property, and the steps we have taken to do so in the U.S. and foreign countries may not be adequate. To the extent we are not successful, our business, financial condition, results of operations, and cash flows could be materially adversely impacted. We may be unable to prevent third parties from using our technology without our authorization, or from independently developing technology that is similar to ours, particularly in those countries where the laws do not protect our proprietary rights as fully as in others. With respect to our pending patent applications, we may not be successful in securing patents for these claims, and our competitors may already have applied for patents that, once issued, will prevail over our patent rights or otherwise limit our ability to sell our products.
Claims by others that we infringe their intellectual property rights could harm our business, financial condition, results of operations, and cash flows.
We have seen a trend towards aggressive enforcement of intellectual property rights as product functionality in our industry increasingly overlaps and the number of issued patents continues to grow. As a result, there is a risk that we could be subject to infringement claims which, regardless of their validity, could:
•be expensive, time consuming, and divert management attention away from normal business operations;
•require us to pay monetary damages or enter into non-standard royalty and licensing agreements;
•require us to modify our product sales and development plans; or
•require us to satisfy indemnification obligations to our customers.
These claims can be burdensome and costly to defend or settle and can harm our business and reputation.
We are subject to cybersecurity risks arising out of breaches of security relating to sensitive company, customer, and employee information and to the technology that manages our operations and other business processes.
Our business operations rely upon secure information technology systems for data capture, processing, storage, and reporting. Our information technology systems, and those of our third-party providers, could become subject to cyber-attacks. Network, system, application, and data breaches could result in operational disruptions or information misappropriation, including, but not limited to, inability to utilize our systems, and denial of access to and misuse of applications required by our clients to conduct business with us. Phishing and other forms of electronic fraud may also subject us to risks associated with improper access to financial assets, customer information and diversion of payments. Theft of intellectual property or trade secrets and inappropriate disclosure of confidential information could stem from such incidents. Any such operational disruption and/or misappropriation of information could result in lost sales, negative publicity or business delays and could have a material adverse effect on our business. In addition, requirements under the privacy laws of the jurisdictions in which we operate, such as the EU General Data Protection Regulation (“GDPR”) and California Consumer Privacy Act, impose significant costs that are likely to increase over time.
RISKS RELATED TO OWNERSHIP OF OUR SECURITIES
The convertible note hedge and warrant transactions may negatively affect the value of our common stock.
In connection with the pricings of our Convertible Senior Notes due 2026 and our Convertible Senior Notes due 2030 (collectively, the “Notes”), we entered into convertible note hedge transactions (the “Hedge Transactions”) with the option counterparties. We also entered into warrant transactions with the option counterparties in each offering of the Notes. The Hedge Transactions are expected generally to reduce the potential dilution to our common stock upon any conversion of Notes and/or offset any cash payments we are required to make in excess of the principal amount of converted Notes, as the case may be. However, the warrant transactions could separately have a dilutive effect on our common stock to the extent that the market price per share of our common stock exceeds the strike price of the warrants.
27
The option counterparties or their respective affiliates may modify their hedge positions by entering into or unwinding various derivatives with respect to our common stock and/or purchasing or selling our common stock or other securities of ours in secondary market transactions prior to the maturity of the Notes (and are likely to do in connection with any conversion of the Notes or redemption or repurchase of the Notes). This activity could cause or avoid an increase or a decrease in the market price of our common stock.
We are subject to counterparty risk with respect to the convertible note hedge transactions.
The option counterparties are financial institutions, and we are subject to the risk that any or all of them might default under the Hedge Transactions. Our exposure to the credit risk of the option counterparties is not secured by any collateral.
If an option counterparty becomes subject to insolvency proceedings, we will become an unsecured creditor in those proceedings with a claim equal to our exposure at that time under the Hedge Transactions with such option counterparty. Our exposure will depend on many factors but, generally, an increase in our exposure will be correlated to an increase in the market price and in the volatility of our common stock. In addition, upon a default by an option counterparty, we may suffer adverse tax consequences and more dilution than we currently anticipate with respect to our common stock. We can provide no assurances as to the financial stability or viability of the option counterparties.
Conversion of the Notes or exercise of the warrants evidenced by the warrant transactions may dilute the ownership interest of existing stockholders.
At our election, we may settle the Notes tendered for conversion entirely or partly in shares of our common stock. Furthermore, the warrants evidenced by the warrant transactions are expected to be settled on a net-share basis. As a result, the conversion of some or all of the Notes or the exercise of some or all of such warrants may dilute the ownership interests of existing stockholders. Any sales in the public market of the common stock issuable upon such conversion of the Notes or such exercise of the warrants could adversely affect prevailing market prices of our common stock and, in turn, the price of the Notes. In addition, the existence of the Notes may encourage short selling by market participants because the conversion of the Notes could depress the price of our common stock.
Our maintenance of two stock exchange listings may adversely affect liquidity in the market for our common stock and could result in pricing differentials of our common stock between the two stock exchanges.
The dual listing of our common stock on the New York Stock Exchange and Nasdaq Iceland hf. (“Nasdaq Iceland”) may split trading between the two markets and adversely affect the liquidity of our common stock in one or both markets and the development of an active trading market for our common stock on Nasdaq Iceland. In addition, such dual listing may result in price differentials between the stock exchanges. Differences in the trading schedules, trading volume and investor bases, as well as volatility in the exchange rate between USD and ISK, the two trading currencies, among other factors, may result in different trading prices for our common stock on the two stock exchanges or otherwise adversely affect liquidity and trading prices of our common stock. It is possible that our stock price might be more volatile than it would be if it were listed on a single stock exchange.
GENERAL RISKS
Fluctuations in currency exchange rates could negatively affect our business, financial condition, and results of operations.
A significant portion of our revenue and expenses are realized in foreign currencies. As a result, changes in exchange rates will result in increases or decreases in our costs and earnings and may adversely affect our Consolidated Financial Statements, which are stated in U.S. dollars. We have entered into hedging transactions to hedge against adverse effects of foreign exchange rate fluctuations on net investments in our Euro functional entities. We also utilize hedging transactions to minimize our exposure to exchange rate volatility on foreign currency sales and purchases made in the normal course of business. Although we have any may continue to seek to minimize our exposure currency exchange risk by engaging in hedging transactions where we deem appropriate, we cannot be assured that our efforts will be successful. Currency fluctuations may also result in our systems and services becoming more expensive and less competitive than those of other suppliers in the foreign countries in which we sell our systems and services.
Our indebtedness increased substantially following the consummation of the Marel Transaction. This increased level of indebtedness could adversely impact our operational flexibility, increase borrowing costs and limit the cash flow available for our operations and we may not be able to generate sufficient cash to service all of our indebtedness. We may be forced to take certain actions to satisfy our obligations under our indebtedness or we may experience a financial failure.
We currently have and may continue to have a significant amount of indebtedness. Our ability to make scheduled payments on or to refinance our debt obligations will depend on our financial and operating performance. If our cash flows and capital resources are
28
insufficient to fund our debt service obligations, we may be forced to reduce or delay capital expenditures, sell assets or operations, seek additional capital or restructure or refinance our indebtedness. We may not be able to take any of these actions, these actions may not be successful and permit us to meet our scheduled debt service obligations and these actions may not be permitted under the terms of our future debt agreements. In the absence of sufficient operating results and resources, we could face substantial liquidity problems and might be required to dispose of material assets or operations to meet our debt service and other obligations. We may not be able to consummate those dispositions or obtain sufficient proceeds from those dispositions to meet our debt service and other obligations then due. Our current and future indebtedness could have negative consequences for our business, results of operations and financial condition by, among other things:
• increasing our vulnerability to adverse economic and industry conditions;
• limiting our ability to obtain additional financing;
• requiring the dedication of a substantial portion of our cash flow from operations to service our indebtedness, which will reduce the amount of cash available for other purposes;
• limiting our flexibility to plan for, or react to, changes in our business;
• diluting the interests of our existing stockholders as a result of issuing shares of our common stock upon conversion of the Notes; and
• placing us at a possible competitive disadvantage with competitors that are less leveraged than us or have better access to capital.
Certain of our loan agreements require us to comply with various restrictive covenants and some contain financial covenants that require us to comply with specified financial ratios and tests. Our failure to meet these covenants could result in default under these loan agreements and would result in a cross-default under other loan agreements. In the event of a default and our inability to obtain a waiver of the default, all amounts outstanding under loan agreements could be declared immediately due and payable. Our failure to comply with these covenants could adversely affect our results of operations and financial condition.
As a result of our acquisition activity, our goodwill and intangible assets have increased significantly in recent years, and we may in the future incur impairments to goodwill or intangible assets.
When we acquire a business, a substantial portion of the purchase price of the acquisition is allocated to goodwill and other identifiable intangible assets. The amount of the purchase price which is allocated to goodwill is determined by the excess of the purchase price over the net identifiable assets acquired. Our balance sheet includes a significant amount of goodwill and other intangible assets, which represents approximately 68% of our total assets as of December 31, 2025. In accordance with Accounting Standards Codification 350 Intangibles-Goodwill and Other, our goodwill and other intangibles are reviewed for impairment annually and whenever events or changes in circumstances indicate that the carrying amount of an asset may not be recoverable. Our valuation methodology for assessing impairment requires management to make judgments and assumptions based on historical experience and to rely heavily on projections of future operating performance. Because we operate in highly competitive environments, projections of our future operating results and cash flows may vary significantly from our actual results. If our estimates or the underlying assumptions change in the future, we may be required to record impairment charges. Any such charge could have a material adverse effect on our reported net income.
Our corporate governance documents and Delaware law may delay or discourage takeovers and business combinations that our stockholders might consider in their best interests.
Provisions in our certificate of incorporation and by-laws may make it difficult and expensive for a third-party to pursue a tender offer, change-in-control, or takeover attempt that is opposed by our management and Board of Directors. These provisions include, among others:
•limitations on the right of stockholders to remove directors;
•the right of our Board of Directors to issue preferred stock without stockholder approval;
•the inability of our stockholders to act by written consent; and
•rules and procedures regarding how stockholders may present proposals or nominate directors at stockholders’ meetings.
Public stockholders who might desire to participate in this type of transaction may not have an opportunity to do so. These anti-takeover provisions could substantially impede the ability of public stockholders to benefit from a change-in-control or a change in our management or Board of Directors and, as a result, may adversely affect the marketability and market price of our common stock.
29
ITEM 1B. UNRESOLVED STAFF COMMENTS
None.
30
ITEM 1C. CYBERSECURITY
31
ITEM 2. PROPERTIES
We lease commercial office space for our corporate headquarters totaling approximately 27,000 square feet in Chicago, Illinois and we own our European headquarters office space totaling approximately 58,000 square feet in Gardabaer, Iceland. We believe that our properties and facilities meet our current operating requirements and are in good operating condition. We believe that each of our significant manufacturing facilities is operating at a level consistent with the industries in which we operate. The following are significant production facilities for our operations:
| LOCATION | SQUARE FEET (approximate) | LEASED OR OWNED | SEGMENT | |||||||||||||||||
| United States: | ||||||||||||||||||||
| Sabetha, Kansas | 367,000 | Owned/Leased | Prepared Food and Beverage Solutions | |||||||||||||||||
| Lakeland, Florida | 200,000 | Owned | Prepared Food and Beverage Solutions | |||||||||||||||||
| Apex, North Carolina | 192,000 | Owned/Leased | Prepared Food and Beverage Solutions | |||||||||||||||||
| Gainesville, Georgia | 187,600 | Owned | Protein Solutions | |||||||||||||||||
| Stratford, Wisconsin | 165,800 | Owned | Prepared Food and Beverage Solutions | |||||||||||||||||
| Madera, California | 148,000 | Owned | Prepared Food and Beverage Solutions | |||||||||||||||||
| Sandusky, Ohio | 140,000 | Owned | Prepared Food and Beverage Solutions | |||||||||||||||||
| Columbus, Ohio | 115,000 | Leased | Protein Solutions | |||||||||||||||||
| Buford, Georgia | 106,000 | Leased | Protein Solutions | |||||||||||||||||
| Eastlake, Ohio | 106,000 | Leased | Prepared Food and Beverage Solutions | |||||||||||||||||
| Kingston, New York | 98,000 | Owned | Protein Solutions | |||||||||||||||||
| Chalfont, Pennsylvania | 83,700 | Leased | Prepared Food and Beverage Solutions | |||||||||||||||||
| Middletown, Ohio | 80,000 | Leased | Prepared Food and Beverage Solutions | |||||||||||||||||
| Alpharetta, Georgia | 65,000 | Leased | Prepared Food and Beverage Solutions | |||||||||||||||||
| Russellville, Arkansas | 65,000 | Owned | Protein Solutions | |||||||||||||||||
| Riverside, California | 50,000 | Leased | Prepared Food and Beverage Solutions | |||||||||||||||||
| International: | ||||||||||||||||||||
| Boxmeer, Netherlands | 785,000 | Owned/Leased | Protein Solutions | |||||||||||||||||
| Nitra, Slovakia | 415,000 | Owned | Protein Solutions | |||||||||||||||||
| Sint Niklaas, Belgium | 307,000 | Owned | Prepared Food and Beverage Solutions | |||||||||||||||||
| Helsingborg, Sweden | 250,000 | Owned/Leased | Prepared Food and Beverage Solutions | |||||||||||||||||
| Lichtenvoorde, Netherlands | 230,000 | Owned | Protein Solutions | |||||||||||||||||
| Stovring, Denmark | 199,000 | Owned/Leased | Protein Solutions | |||||||||||||||||
| Oberlahr, Germany | 185,700 | Owned | Prepared Food and Beverage Solutions | |||||||||||||||||
| Gardabaer, Iceland | 181,500 | Owned | Protein Solutions | |||||||||||||||||
| Guapore, Brazil | 180,000 | Owned | Protein Solutions | |||||||||||||||||
| Eindhoven, Netherlands | 167,500 | Owned | Protein Solutions | |||||||||||||||||
| Werther, Germany | 164,000 | Owned | Prepared Food and Beverage Solutions | |||||||||||||||||
| Kehl, Germany | 138,000 | Owned | Protein Solutions | |||||||||||||||||
| Arhus, Denmark | 130,000 | Owned/Leased | Protein Solutions | |||||||||||||||||
| Araraquara, Brazil | 128,000 | Owned | Prepared Food and Beverage Solutions | |||||||||||||||||
| Venray, Netherlands | 118,400 | Leased | Protein Solutions | |||||||||||||||||
| Valinhos, Brazil | 102,000 | Owned | Prepared Food and Beverage Solutions | |||||||||||||||||
| Adlington, England | 97,000 | Owned | Prepared Food and Beverage Solutions | |||||||||||||||||
| Amsterdam, Netherlands | 96,000 | Leased | Prepared Food and Beverage Solutions | |||||||||||||||||
| Livingston, Scotland | 87,000 | Owned | Prepared Food and Beverage Solutions | |||||||||||||||||
32
LOCATION (continued) | SQUARE FEET (approximate) | LEASED OR OWNED | SEGMENT | |||||||||||||||||
International: | ||||||||||||||||||||
Suzhou, China | 78,000 | Leased | Protein Solutions | |||||||||||||||||
Nieuwkuijk, Netherlands | 67,400 | Owned | Prepared Food and Beverage Solutions | |||||||||||||||||
| Glinde, Germany | 66,800 | Leased | Prepared Food and Beverage Solutions | |||||||||||||||||
Pune, India | 65,000 | Leased | Prepared Food and Beverage Solutions | |||||||||||||||||
| Parma, Italy | 62,000 | Owned | Prepared Food and Beverage Solutions | |||||||||||||||||
| Navarra, Spain | 58,500 | Owned | Prepared Food and Beverage Solutions | |||||||||||||||||
33
ITEM 3. LEGAL PROCEEDINGS
We are involved in legal proceedings arising in the ordinary course of business. Although the results of litigation cannot be predicted with certainty, we do not believe that the resolution of the proceedings that we are involved in, either individually or taken as a whole, will have a material adverse effect on our business, results of operations, cash flows or financial condition.
In the normal course of our business, we are at times subject to pending and threatened legal actions, some for which the relief or damages sought may be substantial. Although we are not able to predict the outcome of such actions, after reviewing all pending and threatened actions with counsel and based on information currently available, management believes that the outcome of such actions, individually or in the aggregate, will not have a material adverse effect on the results of operations or financial position of our Company. However, it is possible that the ultimate resolution of such matters, if unfavorable, may be material to the results of operations in a particular future period as the time and amount of any resolution of such actions and its relationship to the future results of operations are not currently known.
Liabilities are established for pending legal claims only when losses associated with the claims are judged to be probable, and the loss can be reasonably estimated. In many lawsuits and arbitrations, it is not considered probable that a liability has been incurred or not possible to estimate the ultimate or minimum amount of that liability until the case is close to resolution, in which case no liability would be recognized until that time.
34
ITEM 4. MINE SAFETY DISCLOSURES
Not applicable.
35
PART II
ITEM 5. MARKET FOR REGISTRANT’S COMMON EQUITY, RELATED STOCKHOLDER MATTERS AND ISSUER PURCHASES OF EQUITY SECURITIES
The Company’s common stock is listed on the New York Stock Exchange under the symbol JBTM. As of February 23, 2026, there were 1,044 holders of record of our common stock.
For information on securities authorized for issuance under our equity compensation plans, see “Item 12. Security Ownership of Certain Beneficial Owners and Management and Related Stockholder Matters.”
The following graph shows the cumulative total return of an investment of $100 (and reinvestment of any dividends thereafter) on December 31, 2020 in: (i) the Company’s common stock, (ii) the S&P Smallcap 600 Stock Index and (iii) the S&P 1500 Industrial Machinery index. These indices are included for comparative purposes only and do not necessarily reflect management’s opinion that such indices are an appropriate measure of the relative performance of the stock involved, and are not intended to forecast or be indicative of possible future performance of the common stock.
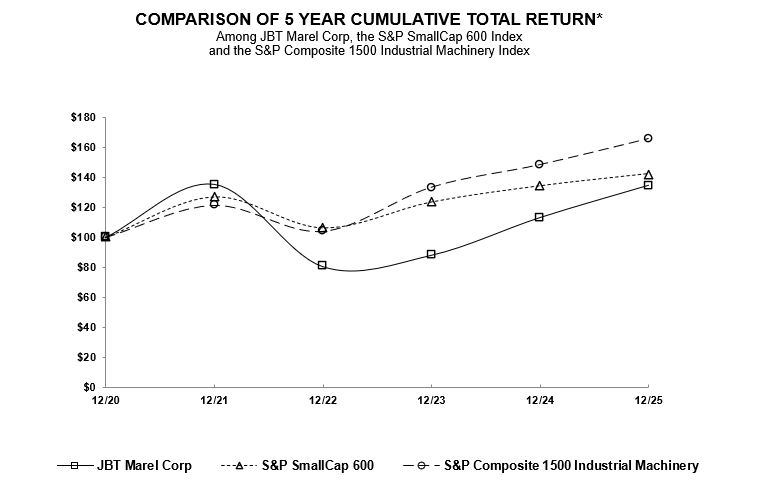
Issuer Purchases of Equity Securities
The Company did not repurchase any shares of its common stock during the quarter ended December 31, 2025. The Company does not currently have an active share repurchase program.
36
ITEM 6. [RESERVED]
37
ITEM 7. MANAGEMENT’S DISCUSSION AND ANALYSIS OF FINANCIAL CONDITION AND RESULTS OF OPERATIONS
Executive Overview
JBT Marel Corporation is a leading global food and beverage technology solutions provider to high-value segments of the food and beverage industry. Fueled by our purpose to transform the future of food, we help our customers maximize production output and performance through our diverse food application knowledge and integrated solutions offerings.
We specialize in designing, manufacturing, and servicing cutting-edge technology, systems, and software for a broad range of food and beverage end markets. We aim to create better outcomes for our diverse customers by optimizing food yield and efficiency, improving food safety and quality, and enhancing uptime and proactive maintenance, all while reducing waste and resource use across the global food supply chain.
Our strategy capitalizes on favorable trends, as well as our leadership position, in the food and beverage processing industry. This strategy is based on a five-pronged approach to deliver continued growth and margin expansion.
•Strengthening Solutions and Value Proposition. We offer a broad portfolio of solutions developed for various food and beverage end markets to meet diverse customer and sustainability needs with precision and flexibility to fuel organic growth.
•Enhancing Service Offerings and Customer Relationships. Leveraging our industry expertise, we deliver high-quality service to minimize downtime, optimize performance, and strengthen customer partnerships with responsive support and reliable parts delivery.
•Advanced Digital and Software Capabilities. We deliver greater value through cutting-edge digital tools and software to improve productivity, reduce downtime, and optimize food and beverage processing.
•Focus on Innovation. By expanding our portfolio through cutting edge innovation, we enhance technology leadership and deepen customer partnerships with advanced capabilities.
•Leveraging Our Scale to Expand Margins. By utilizing our resources and great talent, we drive efficiencies, achieve synergies, and deliver margin expansion, all while creating more value for our customers.
Our approach to Environmental, Social and Governance (ESG) initiatives is embedded in our overall company strategy and is advanced through five key pillars, related to:
•Our customers, to whom we offer diverse solutions, operational scale and application, service, and digital expertise focused on enabling customers to reach their sustainability goals;
•Our products and service solutions that offer efficient energy and water usage, extend product shelf life and equipment lifespans, contribute to food traceability and safety, and help minimize food loss;
•Our people and communities, for and with whom we are creating a values-driven workplace, ensuring all employees have the tools they need to succeed and experience a sense of belonging;
•Our operations, where we are integrating practices to reduce our greenhouse gas (GHG) emissions, curb energy use, minimize waste generation, and optimize water use; and
•Our supply partners, with whom we are engaging to better understand their environmental impact and identify collaborative opportunities to more effectively achieve common sustainability goals.
Strategic Acquisition of Marel hf.
On January 2, 2025, the Company closed the acquisition of Marel, a multi-national food processing company based in Gardabaer, Iceland that manufactures equipment and provides other services for food processing in the poultry, meat, fish, and pet food industries. The purpose of the Marel Transaction was to create a leading and diversified global food and beverage technology solutions provider by bringing together two renowned companies with long histories, complementary product portfolios, highly respected brands, and cutting-edge technology to enable global customers to more efficiently access industry leading technology worldwide. Refer to Note 2. Acquisitions of the Notes to the Consolidated Financial Statements for additional information on the Marel Transaction.
38
In conjunction with the combination of JBT and Marel, JBT changed its corporate name and stock ticker symbol to “JBT Marel Corporation” and “JBTM,” respectively, on January 2, 2025.
The disclosures in this “Item 7. Management’s Discussion and Analysis of Financial Condition and Results of Operations” of the Annual Report on Form 10-K speak to the combined company subsequent to the Marel Transaction unless otherwise noted.
Business Segments
Following the acquisition of Marel on January 2, 2025, we operated through two segments, JBT and Marel, which were comprised of the legacy operations of each business. During the fourth quarter of 2025, we realigned our reportable segments to better reflect the integration of our new operating model. We now operate through two reportable segments: Protein Solutions and Prepared Food and Beverage Solutions.
The Protein Solutions segment includes businesses that provide solutions for initial stage processing and harvesting of animal proteins, primarily focusing on poultry, pork, fish, and beef. Examples of core technologies include primary processing systems, cut-up, bone detection and removal, portioning, and robotic batching.
The Prepared Food and Beverage Solutions segment includes businesses that offer solutions predominantly for downstream value-added preparation, preservation, and packaging of foods and beverages into ready to eat or drink products. This segment also includes capabilities for pet food, dairy, bakery, pharmaceutical and nutraceutical, and warehouse automation end markets. Examples of core technologies include meat preparation, forming, cutting, slicing, cooking, freezing, extraction, blending, filling, preservation, labeling, packaging, and automated guided vehicles.
For further segment information, see below ‘Operating Results of Business Segments’ and Note 20 of the Notes to Consolidated Financial Statements in Part II, Item 8: Financial Statements and Supplementary Data of this Form 10-K.
39
Business Conditions and Outlook
Our 2025 financial performance was driven by strong demand, particularly for poultry solutions, healthy backlog conversion, and successful execution of margin improvement initiatives.
We experienced resilient demand for our aftermarket parts and service products, generating approximately 50% of total revenue from recurring revenue. Additionally, equipment orders from the poultry end market were robust with healthy equipment demand from other diversified end markets, including meat, beverages, ready meals, and pharmaceuticals. JBT Marel’s margin performance benefited from realized synergy savings and continuous improvement initiatives.
For full year 2026 we believe that effective backlog conversion and healthy demand will help deliver year-over-year revenue growth. We are also focused on improving year-over-year margins through ongoing execution of synergy cost savings projects coupled with volume leverage and continuous improvement efficiencies.
40
Results of Continuing Operations
A discussion of JBT Marel’s results of operations for 2025 compared to 2024 is set forth below.
CONSOLIDATED RESULTS OF OPERATIONS
YEARS ENDED DECEMBER 31, 2025 AND 2024
| Year Ended December 31, | Favorable / (Unfavorable) | ||||||||||||||||||||||
| (In millions) | 2025 | 2024 | Change | Change % | |||||||||||||||||||
| Revenue | $ | 3,798.2 | $ | 1,716.0 | $ | 2,082.2 | 121.3% | ||||||||||||||||
| Cost of sales | 2,463.6 | 1,089.5 | (1,374.1) | (126.1)% | |||||||||||||||||||
| Gross profit | 1,334.6 | 626.5 | 708.1 | 113.0% | |||||||||||||||||||
| Gross profit margin | 35.1% | 36.5% | -140 bps | ||||||||||||||||||||
| Selling, general and administrative expense | 1,115.9 | 506.7 | (609.2) | (120.2)% | |||||||||||||||||||
| Restructuring expense | 29.3 | 1.4 | (27.9) | (1,992.9)% | |||||||||||||||||||
| Operating income | 189.4 | 118.4 | 71.0 | 60.0% | |||||||||||||||||||
| Pension expense, other than service cost | 148.5 | 27.3 | (121.2) | (444.0)% | |||||||||||||||||||
| Interest (income) | (11.1) | (23.7) | (12.6) | (53.2)% | |||||||||||||||||||
| Interest expense | 114.4 | 19.4 | (95.0) | (489.7)% | |||||||||||||||||||
| Loss on investment | 10.6 | — | (10.6) | (100.0)% | |||||||||||||||||||
| Other (income) | (10.6) | — | 10.6 | 100.0% | |||||||||||||||||||
| (Loss) income from continuing operations before income taxes | (62.4) | 95.4 | (157.8) | (165.4)% | |||||||||||||||||||
| Income tax (benefit) provision | (13.1) | 10.7 | 23.8 | 222.4% | |||||||||||||||||||
| Equity in net earnings of unconsolidated affiliate | (0.4) | (0.1) | (0.3) | (300.0)% | |||||||||||||||||||
| (Loss) income from continuing operations | (49.7) | 84.6 | (134.3) | (158.7)% | |||||||||||||||||||
| Income from discontinued operations, net of taxes | (0.8) | 0.8 | (1.6) | (200.0)% | |||||||||||||||||||
| Net (loss) income | $ | (50.5) | $ | 85.4 | $ | (135.9) | (159.1)% | ||||||||||||||||
Adjusted EBITDA from continuing operations(1) | $ | 600.4 | $ | 295.0 | $ | 305.4 | 103.5% | ||||||||||||||||
| Income (loss) from continuing operations margin | (1.3) | % | 4.9 | % | -620 bps | ||||||||||||||||||
Adjusted EBITDA margin from continuing operations(1) | 15.8 | % | 17.2 | % | -140 bps | ||||||||||||||||||
(1) Refer to the ‘Reconciliation of Non-GAAP Measures’ section below for additional information on Adjusted EBITDA from continuing operations.
2025 Compared With 2024
Revenue
Total revenue in 2025 increased $2,082.2 million or 121.3% compared to 2024. The acquisition of Marel provided additional revenue of $1,966.0 million, which is inclusive of a favorable foreign currency translation impact of $50.5 million. Organic revenue grew by $39.8 million and foreign currency translation was favorable by $76.5 million compared to the prior year. The increase in organic revenue was primarily the result of an increase in volume for recurring revenue.
Gross profit margin
Gross profit margin decreased 140 bps to 35.1% compared to 36.5% in 2024. The decrease was driven primarily by tariff impacts and operating inefficiencies on select projects within our Prepared Food and Beverage Solutions segment. This decrease was partially offset by synergy savings and an increased mix of recurring revenue compared to the prior year, which tends to have higher margins than non-recurring revenue.
41
Selling, general and administrative expense
Selling, general and administrative expense increased $609.2 million compared to the prior year. This increase was primarily driven by the acquisition of Marel and higher costs associated with the integration. Selling, general and administrative expense as a percentage of revenue was flat compared to 2024.
Pension expense, other than service cost
Pension expense, other than service cost increased $121.2 million compared to the prior year. This increase was primarily due to the settlement charge of $146.9 million recognized in the first quarter of 2025 upon the termination of the U.S. qualified defined benefit pension plan, compared to $23.3 million of settlement charges recognized in 2024 as part of the partial termination of this plan.
Interest income, interest expense, and other income
Interest income decreased $12.6 million compared to 2024. This decrease was due to the Company having lower cash balances on hand to invest after funding the Marel Transaction in the first quarter of 2025.
Interest expense increased $95.0 million compared to 2024. This increase was driven by a higher average debt balance on additional borrowings to fund the Marel Transaction in the first quarter of 2025, partially offset by a benefit from our cross-currency swap derivative instruments designated as net investment hedges. Additional borrowing was drawn from our revolving credit facility and Term Loan B that was executed on January 2, 2025.
Other income of $10.6 million recognized during 2025 relates to our cross-currency swap agreements that, for a portion of our Term Loan B debt, synthetically swap a higher interest expense based on the SOFR interest rate with a lower interest expense based on the EURIBOR interest rate and a credit spread.
Income tax (benefit) provision
The tax rate on the loss from continuing operations was 21.0% for the year ended December 31, 2025. The tax benefit for the year ended December 31, 2025 was unfavorably impacted by discrete items totaling $5.9 million, primarily driven by non-deductible acquisition costs.
The tax rate on the income from continuing operations was 11.2% for the year ended December 31, 2024. The tax rate for the year ended December 31, 2024 was favorably impacted by discrete items totaling $10.0 million, primarily driven by a non-recurring deferred tax benefit related to an internal reorganization.
(Loss) income from continuing operations and Adjusted EBITDA
Loss from continuing operations for the year ended December 31, 2025 was $49.7 million compared to income from continuing operations of $84.6 million in 2024, representing a decrease of $134.3 million. The decrease was primarily due to higher pension expense other than service cost, interest expense, loss on investment, and the impact of discrete items on our income tax provision. This was partially offset by the operating income from the acquired Marel business and savings from our JBT Marel 2025 Integration restructuring plan.
Adjusted EBITDA was $600.4 million for the year ended December 31, 2025 compared to $295.0 million in 2024, representing an increase of $305.4 million or 103.5%. The increase in Adjusted EBITDA was primarily driven by incremental gross profit attributable to the recently acquired Marel business and integration synergies, partially offset by higher selling, general and administrative expense, excluding the impacts of our depreciation, amortization, and acquisition and integration costs.
Loss from continuing operations margin decreased 620 bps to (1.3)% compared to 4.9% in 2024. This decrease is the result of higher pension expense other than service cost, higher restructuring and integration costs, higher interest expense, the loss on investment, and the impact of discrete items on our income tax provision compared to 2024. Adjusted EBITDA margin decreased 140 bps to 15.8% compared to 17.2% in 2024. This decrease was primarily attributable to a lower gross profit margin and a higher selling, general, and administrative expense as a percentage of revenue from the acquired Marel business relative to the legacy JBT business. This was partially offset by savings from our JBT Marel 2025 Integration restructuring plan.
42
OPERATING RESULTS OF BUSINESS SEGMENTS
| Year Ended December 31, | Favorable / (Unfavorable) | ||||||||||||||||||||||
| (In millions) | 2025 (1) | 2024 (1) | Change | Change % | |||||||||||||||||||
Segment revenue | |||||||||||||||||||||||
| Protein Solutions | $ | 1,716.2 | $ | 168.7 | $ | 1,547.5 | 917.3% | ||||||||||||||||
| Prepared Food and Beverage Solutions | 2,082.0 | 1,547.3 | 534.7 | 34.6% | |||||||||||||||||||
| Total revenue | $ | 3,798.2 | $ | 1,716.0 | $ | 2,082.2 | 121.3% | ||||||||||||||||
Segment Adjusted EBITDA (2) | |||||||||||||||||||||||
| Protein Solutions | $ | 344.7 | $ | 57.5 | $ | 287.2 | 499.5% | ||||||||||||||||
| Prepared Food and Beverage Solutions | 358.7 | 301.2 | 57.5 | 19.1% | |||||||||||||||||||
| Segment Adjusted EBITDA margin | |||||||||||||||||||||||
| Protein Solutions | 20.1% | 34.1% | -1400 bps | ||||||||||||||||||||
| Prepared Food and Beverage Solutions | 17.2% | 19.5% | -230 bps | ||||||||||||||||||||
(1) Effective in the fourth quarter of 2025, segment results for the years ended December 31, 2025 and 2024 were recast to reflect the Company’s realignment of its reportable segments.
(2) Refer to Note 20. Business Segments of the Notes to the Consolidated Financial Statements for additional information on segment Adjusted EBITDA.
Protein Solutions
2025 Compared With 2024
Protein Solutions segment revenue increased $1,547.5 million or 917.3% compared to 2024. The increase in revenue was primarily due to the additional revenue provided by the acquisition of Marel.
Protein Solutions segment Adjusted EBITDA and segment Adjusted EBITDA margin was $344.7 million or 20.1% for the year ended December 31, 2025 compared to $57.5 million or 34.1% in 2024. The increase of $287.2 million or 499.5% was primarily driven by incremental gross profit attributable to the recently acquired Marel business. The decrease in Adjusted EBITDA margin was primarily attributable to tariff impacts and a lower gross profit margin from the acquired Marel business as well as higher selling, general and administrative expenses compared to the same period in the prior year.
Prepared Food and Beverage Solutions
2025 Compared With 2024
Prepared Food and Beverage Solutions revenue increased $534.7 million or 34.6% compared to 2024. Revenue growth was driven by an increase in volume for recurring revenue and the additional revenue provided by the acquisition of Marel.
Prepared Food and Beverage Solutions segment Adjusted EBITDA and segment Adjusted EBITDA margin was $358.7 million or 17.2% for the year ended December 31, 2025 compared to $301.2 million or 19.5% in 2024. The increase of $57.5 million or 19.1% was primarily driven by incremental gross profit attributable to the recently acquired Marel business with a negative impact from a decrease in gross profit from tariff impacts and unfavorable mix as well as higher selling, general and administrative expenses compared to the same period in the prior year.
43
| Year Ended December 31, | Favorable / (Unfavorable) | ||||||||||||||||||||||
| (In millions) | 2024 (1) | 2023 (1) | Change | Change % | |||||||||||||||||||
Segment revenue | |||||||||||||||||||||||
| Protein Solutions | $ | 168.7 | $ | 187.8 | $ | (19.1) | (10.2)% | ||||||||||||||||
| Prepared Food and Beverage Solutions | 1,547.3 | 1,476.6 | 70.7 | 4.8% | |||||||||||||||||||
| Total revenue | $ | 1,716.0 | $ | 1,664.4 | $ | 51.6 | 3.1% | ||||||||||||||||
Segment Adjusted EBITDA (2) | |||||||||||||||||||||||
| Protein Solutions | $ | 57.5 | $ | 57.7 | $ | (0.2) | (0.3)% | ||||||||||||||||
| Prepared Food and Beverage Solutions | 301.2 | 277.5 | 23.7 | 8.5% | |||||||||||||||||||
| Segment Adjusted EBITDA margin | |||||||||||||||||||||||
| Protein Solutions | 34.1% | 30.7% | 340 bps | ||||||||||||||||||||
| Prepared Food and Beverage Solutions | 19.5% | 18.8% | 70 bps | ||||||||||||||||||||
(1) Effective in the fourth quarter of 2025, segment results for the years ended December 31, 2024 and 2023 were recast to reflect the Company’s realignment of its reportable segments.
(2) Refer to Note 20. Business Segments of the Notes to the Consolidated Financial Statements for additional information on segment Adjusted EBITDA.
Protein Solutions
2024 Compared With 2023
Protein Solutions segment revenue decreased by $19.1 million or 10.2% for the year ended December 31, 2024 compared to 2023. The decrease in revenue was driven by a decline in demand in the protein market.
Protein Solutions segment Adjusted EBITDA and segment Adjusted EBITDA margin was $57.5 million or 34.1% for the year ended December 31, 2024 compared to $57.7 million or 30.7% in 2023. Segment adjusted EBITDA was flat year-over-year.The increase in segment Adjusted EBITDA margin of 340 bps was primarily driven by a change in mix to higher recurring revenue, which generally has a higher gross margin compared to non-recurring revenue, compared to the prior year.
Prepared Food and Beverage Solutions
2024 Compared With 2023
Prepared Food and Beverage Solutions segment revenue increased $70.7 million or 4.8% compared to 2023. The growth in revenue was driven by an increase in volume for recurring and non-recurring revenue.
Prepared Food and Beverage Solutions segment Adjusted EBITDA and segment Adjusted EBITDA margin was $301.2 million or 19.5% for the year ended December 31, 2024 compared to $277.5 million or 18.8% in 2023. The increase of $23.7 million or 8.5% was primarily driven by higher segment revenues and gross profit performance from mix and continuous improvement initiatives with negative impact from higher selling, general and administrative expense compared to the same period in the prior year.
44
Reconciliation of Non-GAAP Measures
We present non-GAAP (as defined below) financial measures in this annual report on Form 10-K. These non-GAAP financial measures adjust for certain amounts that are otherwise included or excluded from a measure calculated under U.S. generally accepted accounting principles (“GAAP”). By adjusting for these items, we believe we provide greater transparency into our operating results and trends, and a more meaningful comparison of our ongoing operating results, consistent with how management evaluates performance. Management uses these non-GAAP financial measures in financial and operational evaluation, planning and forecasting. We also believe that these non-GAAP measures are useful to investors as a way to evaluate and compare our operating performance against peers in the Company’s industry. The adjustments generally fall within the following categories: restructuring costs, M&A related costs, pension-related costs, constant currency adjustments and other major items affecting comparability of our ongoing operating results.
The non-GAAP financial measures presented in this report may differ from similarly-titled measures used by other companies. The non-GAAP financial measures are not intended to be used as a substitute for, nor should they be considered in isolation of, financial measures prepared in accordance with U.S. GAAP.
Additional details for each Non-GAAP financial measure follow:
•Adjusted EBITDA and Adjusted EBITDA margin: We define Adjusted EBITDA as earnings adjusted for income taxes, interest expense (income), net, other financing income, pension expense other than service cost, restructuring, M&A related and other costs and depreciation and amortization, including acquisition related depreciation and amortization. We define Adjusted EBITDA margin as Adjusted EBITDA divided by revenue.
•Adjusted income from continuing operations and Adjusted diluted earnings per share from continuing operations: We adjust earnings for restructuring expense, M&A related and other costs, which include integration costs, amortization of inventory step-up from business combinations, impacts of foreign currency derivatives and trades to hedge variability of exchange rates on the cash consideration paid for business combination, advisory and transaction costs for both potential and completed M&A transactions and strategy, acquisition related amortization and depreciation, amortization of debt issuance costs related to bridge financing for potential M&A transactions, non-cash pension plan related settlement costs and the related tax impact.
•Free cash flow: We define free cash flow as cash provided by continuing operating activities, less capital expenditures, plus proceeds from sale of fixed assets and pension contributions. For free cash flow purposes, we consider contributions to pension plans to be more comparable to the payment of debt, and therefore exclude these contributions from the calculation of free cash flow.
The tables below reconcile each non-GAAP financial measure to the most comparable GAAP financial measure.
The following table presents a reconciliation of the Company’s reported Income from continuing operations to Adjusted EBITDA from continuing operations.
| Year Ended December 31, | |||||||||||||||||
| (In millions) | 2025 | 2024 | 2023 | ||||||||||||||
| Income from continuing operations | $ | (49.7) | $ | 84.6 | $ | 129.3 | |||||||||||
| Income tax (benefit) provision | (13.1) | 10.7 | 23.5 | ||||||||||||||
| Interest (income) expense, net | 103.3 | (4.3) | 10.9 | ||||||||||||||
Other financing (income) (1) | (10.6) | — | — | ||||||||||||||
| Loss on investment | 10.6 | — | — | ||||||||||||||
Pension expense, other than service cost (2) | 148.5 | 27.3 | 0.7 | ||||||||||||||
Restructuring related costs (3) | 30.7 | 1.4 | 11.4 | ||||||||||||||
M&A related costs (4) | 114.5 | 85.9 | 6.0 | ||||||||||||||
Depreciation and amortization (5) | 266.2 | 89.4 | 91.3 | ||||||||||||||
| Adjusted EBITDA from continuing operations | $ | 600.4 | $ | 295.0 | $ | 273.1 | |||||||||||
(1) Other financing income represents transaction gains from fair value hedges on our foreign currency denominated debt, and are considered non-operating as they relate to our cost of borrowing on this debt.
(2) Pension expense, other than service cost, is excluded as it represents all non service-related pension expense, which consists of non-cash interest cost, expected return on plan assets, amortization of actuarial gains and losses, and settlement charges.
45
(3) Costs incurred as a direct result of the restructuring program are excluded because they are not part of the ongoing operations of our underlying business.
(4) M&A related and other costs include advisory and transaction related costs for both potential and completed M&A transactions and strategy of $57.9 million, amortization of inventory step-up from business combinations of $21.2 million, and integration costs of $35.4 million. M&A related and other costs are excluded as they are generally short-term in nature and turn over quickly or are not part of the ongoing operations of our underlying business.
(5) Depreciation and amortization, including the acquisition related amortization and depreciation expense, is excluded to determine Adjusted EBITDA.
The table below provides a reconciliation of income from continuing operations as reported to adjusted income from continuing operations and adjusted diluted earnings per share from continuing operations.
| Year Ended December 31, | |||||||||||||||||
| (In millions, except per share data) | 2025 | 2024 | 2023 | ||||||||||||||
| (Loss) income from continuing operations | $ | (49.7) | $ | 84.6 | $ | 129.3 | |||||||||||
| Non-GAAP adjustments | |||||||||||||||||
| Restructuring related costs | 30.7 | 1.4 | 11.4 | ||||||||||||||
| M&A related costs | 114.5 | 85.9 | 6.0 | ||||||||||||||
| Loss on investment | 10.6 | — | — | ||||||||||||||
| Amortization of bridge financing debt issuance cost | 12.4 | 7.1 | — | ||||||||||||||
| Acquisition related amortization and depreciation | 179.0 | 44.6 | 46.1 | ||||||||||||||
Impact on tax provision from Non-GAAP adjustments(1) | (79.6) | (34.1) | (16.1) | ||||||||||||||
| Recognition of non-cash pension plan related settlement costs | 146.9 | 23.3 | — | ||||||||||||||
| Impact on tax provision from non-cash pension plan related settlement costs | (37.1) | (6.0) | — | ||||||||||||||
| Discrete tax adjustment from M&A activity | 5.4 | — | — | ||||||||||||||
| Impact on tax provision from tax basis write-off | — | — | (10.7) | ||||||||||||||
| Deferred tax benefit related to an internal reorganization | — | (8.8) | — | ||||||||||||||
| Adjusted income from continuing operations | $ | 333.1 | $ | 198.0 | $ | 166.0 | |||||||||||
| (Loss) income from continuing operations | $ | (49.7) | $ | 84.6 | $ | 129.3 | |||||||||||
| Total shares and dilutive securities | 52.0 | 32.2 | 32.1 | ||||||||||||||
| Diluted earnings per share from continuing operations | $ | (0.96) | $ | 2.63 | $ | 4.02 | |||||||||||
| Adjusted income from continuing operations | $ | 333.1 | $ | 198.0 | $ | 166.0 | |||||||||||
| Total shares and dilutive securities | 52.0 | 32.2 | 32.1 | ||||||||||||||
| Adjusted diluted earnings per share from continuing operations | $ | 6.41 | $ | 6.15 | $ | 5.17 | |||||||||||
(1) Impact on tax provision was calculated using the enacted rate for the relevant jurisdiction for the years ended December 31, 2025, 2024, and 2023, respectively.
The table below provides a reconciliation of cash provided by operating activities to free cash flow.
| Year Ended December 31, | |||||||||||||||||
| (in millions) | 2025 | 2024 | 2023 | ||||||||||||||
| Cash provided by continuing operating activities | $ | 341.7 | $ | 232.6 | $ | 74.2 | |||||||||||
| Less: capital expenditures | 103.6 | 37.9 | 55.1 | ||||||||||||||
| Plus: proceeds from disposal of assets | 6.6 | 1.4 | 2.1 | ||||||||||||||
| Plus: pension contributions | 5.1 | 3.2 | 12.1 | ||||||||||||||
| Plus: income taxes on gain from sale of AeroTech | — | — | 133.2 | ||||||||||||||
| Free cash flow (FCF) | $ | 249.8 | $ | 199.3 | $ | 166.5 | |||||||||||
46
Free cash flow for the year ended December 31, 2025 was $249.8 million, which includes payment for acquisition costs of the Marel Transaction of approximately $101 million, representing an increase of $50.5 million and $83.3 million compared to 2024 and 2023, respectively.
Restructuring
In the third quarter of 2022, the Company implemented a restructuring plan (the “2022/2023 restructuring plan”) to optimize the overall cost structure for the Company on a global basis. The initiatives under this plan included streamlining operations and enhancing our general and administrative infrastructure. The 2022/2023 restructuring plan was completed as of March 31, 2024. The total cost in connection with this plan was $17.5 million.
In the first quarter of 2025, the Company implemented the JBT Marel 2025 Integration restructuring plan to achieve a portion of its synergy targets identified as a result of the Marel acquisition to optimize the overall cost structure for the combined Company on a global basis. The initiatives under this plan include streamlining operations and adjusting our general and administrative infrastructure to meet the strategic needs of JBT Marel. The total estimated cost in connection with this plan was revised in the third quarter from $25.0 million to $30.0 million to a range of $30.0 million to $35.0 million, and was further updated at year-end to a range of $55.0 million to $60.0 million. These changes are due to additional footprint optimization initiatives. We recognized restructuring charges of $31.2 million, net of a cumulative release of the related liability of $0.4 million through December 31, 2025, and expect to recognize the remaining costs by the end of 2026.
The following table details the cumulative amount of annualized savings and incremental savings for the JBT Marel 2025 Integration restructuring plan:
| Cumulative Amount | Incremental Amount | Cumulative Amount | |||||||||||||||
| (In millions) | As of December 31, 2024 | During the year ended December 31, 2025 | As of December 31, 2025 | ||||||||||||||
| Cost of sales | $ | — | $ | 3.6 | $ | 3.6 | |||||||||||
| Selling, general and administrative | — | 23.1 | 23.1 | ||||||||||||||
| Total restructuring savings | $ | — | $ | 26.7 | $ | 26.7 | |||||||||||
Cumulative cost savings for the JBT Marel 2025 Integration restructuring plan are expected to be between $65.0 million and $75.0 million.
For additional financial information about restructuring, refer to Note 21. Restructuring of the Notes to Consolidated Financial Statements.
Inbound Orders and Order Backlog
Inbound orders represent the estimated sales value of confirmed customer orders received during the year. Inbound orders from continuing operations during the year ended December 31, 2025 and 2024 were $3,842.7 million and $1,788.3 million, respectively.
Inbound orders from continuing operations increased $2,054.4 million for the year ended December 31, 2025 compared to 2024. The acquisition of Marel provided additional inbound of $2,105.5 million and the impact of foreign currency translation was favorable by $78.8 million in the period, resulting in a decrease of $130.0 million on a constant currency basis.
Order backlog is calculated as the estimated sales value of unfilled, confirmed customer orders. Order backlog as of December 31, 2025 and 2024 was $1,372.0 million and $720.5 million, respectively.
Order backlog from continuing operations at December 31, 2025 increased by $651.5 million compared to December 31, 2024, primarily due to the acquisition of Marel. We expect to convert 85 % to 95 % of backlog at December 31, 2025 into revenue during 2026.
Seasonality
We experience seasonality in our operating results. Our revenue and operating income are generally lower in the first quarter and highest in the fourth quarter, primarily as a result of our customers’ purchasing trends.
47
Liquidity and Capital Resources
Overview of Sources and Uses of Cash
Our primary sources of liquidity are cash flows provided by operating activities from our operations, our revolving credit facility, proceeds from the issuance of the Convertible Senior Notes due 2030 (the “2030 Notes”) on September 9, 2025, and our cash and cash equivalents on hand. We used a portion of the proceeds from the 2030 Notes to pay the net cost of the related convertible note hedge and warrant transactions and with the remaining proceeds, repaid a portion of the borrowings outstanding under our revolving credit facility.
In connection with the Marel Transaction, we drew an additional $604 million from our existing revolving credit facility on December 30, 2024. On January 2, 2025, we secured takeout financing comprised of the amended and restated 5-year, $1.8 billion revolving credit facility and $900 million in the Senior Secured Term Loan B (“Term Loan B”). The takeout financing resulted in the carryforward of the initial $604 million borrowing from our existing revolving credit facility and additional borrowings of $900 million drawn from the Term Loan B and $18.6 million from the amended revolving credit facility to fund the Marel Transaction, subsequent acquisition of the non-controlling interest of Marel, and related expenditures.
On January 2, 2025, we closed the Marel Transaction by acquiring approximately 97.5% of Marel's issued and outstanding equity interests. On February 4, 2025, we acquired the remaining 2.5% of Marel's issued and outstanding equity interests (the “Squeeze out”). Upon the closing of the Marel Transaction on January 2, 2025 and the Squeeze out on February 4, 2025, we used available cash and additional borrowings from the takeout financing to fund $983.7 million of cash consideration paid to the Marel shareholders, $867.8 million for repayment of Marel's debt, $111.4 million for transaction related expenses, and $16.1 million for debt issuance costs.
For the year ended December 31, 2025, we had total operating cash flows from continuing operations of $341.7 million. Our liquidity as of December 31, 2025, or cash plus borrowing ability under our revolving credit facilities, was $2.0 billion. The takeout financing included a leverage holiday that permitted a maximum secured leverage ratio of 5.0x for the initial 12-months after the Marel Transaction close date and a total leverage ratio of 5.75x. On January 2, 2026, our maximum secured leverage ratio stepped-down to 4.0x, which did not result in a change in our calculated liquidity.
Our liquidity is available for repayment of the Convertible Senior Notes due 2026 (the “2026 Notes”) and to support the continued integration of JBT and Marel and our other capital allocation priorities. Based on our current capital allocation objectives for the combined company, we anticipate capital expenditures to be between $105 million and $115 million during 2026. Our level of capital expenditures varies from time to time as a result of actual and anticipated business conditions. During 2026, we also expect to incur integration costs and other synergy-related costs in the range of $45 million to $55 million related to the acquisition of Marel.
Additionally, the cash flows generated by the continuing operations of the combined company are expected to be sufficient to satisfy our principal cash requirements that include our working capital needs, new product development, restructuring expenses, capital expenditures, income taxes, debt interest and repayments, dividends, and other financing arrangements.
As of December 31, 2025, we had $167.9 million of cash and cash equivalents, $101.8 million of which was held by our foreign subsidiaries. Although certain funds are considered permanently invested in our foreign subsidiaries, we are not presently aware of any restriction on the repatriation of these funds. We maintain significant operations outside of the U.S., and many of our uses of cash for working capital, capital expenditures and business acquisitions arise in these foreign jurisdictions. If these funds were needed to fund our operations or satisfy obligations in the U.S., they could be repatriated and their repatriation into the U.S. could cause us to incur additional U.S. income tax and foreign withholding taxes. The foreign withholding taxes on these repatriations to the U.S. would potentially be partially offset by U.S. foreign tax credits.
As noted above, certain funds held outside of the U.S. are considered permanently invested in our non-U.S. subsidiaries. At times, these foreign subsidiaries have cash balances that exceed their immediate working capital or other cash needs. In these circumstances, the foreign subsidiaries may loan funds to the U.S. parent company on a temporary basis; the U.S. parent company has in the past and may in the future use the proceeds of these temporary intercompany loans to reduce outstanding borrowings under our committed credit facilities. By using available non-U.S. cash to repay our debt on a short-term basis, we can optimize our leverage ratio, which has the effect of lowering our interest costs.
48
Contractual Obligations and Cash Requirements
The following is a summary of our significant contractual and other obligations at December 31, 2025:
| (In millions) | Total Payments | Current | Long-Term | ||||||||||||||
Long-term debt (a) | $ | 1,910.3 | $ | 412.7 | $ | 1,497.6 | |||||||||||
Interest payments on long-term debt (b) | 324.9 | 55.3 | 269.6 | ||||||||||||||
Operating leases (c) | 94.7 | 22.2 | 72.5 | ||||||||||||||
Total contractual and other obligations (d) | $ | 2,329.9 | $ | 490.2 | $ | 1,839.7 | |||||||||||
(a)A summary of our long-term debt obligations as of December 31, 2025 can be found in Note 8, “Debt”, of the Notes to the Consolidated Financial Statements.
(b)Amounts include contractual interest payments using the interest rates as of December 31, 2025.
(c)A summary of our operating lease obligations as of December 31, 2025 can be found in Note 19, “Leases”, of the Notes to the Consolidated Financial Statements.
(d)This table does not include obligations under our pension and postretirement benefit plans, which are included in Note 10, Pension and Post-Retirement and Other Benefit Plans, of the Notes to the Consolidated Financial Statements.
We also have outstanding firm purchase orders with certain suppliers for the purchase of raw materials and services, which are not included in the table above. These purchase orders are generally short-term in nature and include a requirement that our supplier provide products or services to our specifications and require us to make a firm purchase commitment to our supplier. The costs associated with these agreements will be reflected in cost of sales on our Consolidated Statements of Income as substantially all of these commitments are associated with purchases made to fulfill our customers’ orders.
The following is a summary of other off-balance sheet arrangements at December 31, 2025:
| (In millions) | Total Amount | Current | Long-Term | ||||||||||||||
| Letters of credit and bank guarantees | $ | 72.4 | $ | 55.5 | $ | 16.9 | |||||||||||
| Surety bonds | 6.3 | 6.0 | 0.3 | ||||||||||||||
| Total other off-balance sheet arrangements | $ | 78.7 | $ | 61.5 | $ | 17.2 | |||||||||||
To provide required security regarding our performance on certain contracts, we provide letters of credit, surety bonds and bank guarantees, for which we are contingently liable. In order to obtain these financial instruments, we pay fees to various financial institutions in amounts competitively determined in the marketplace. Our ability to generate revenue from certain contracts is dependent upon our ability to obtain these off-balance sheet financial instruments.
Our off-balance sheet financial instruments may be renewed, revised or released based on changes in the underlying commitment. Historically, our commercial commitments have not been drawn upon to a material extent; consequently, management believes it is not likely that there will be claims against these commitments that would result in a negative impact on our key financial ratios or our ability to obtain financing.
Cash Flows
Cash flows for each of the years ended December 31, 2025, 2024, and 2023 were as follows:
| (In millions) | 2025 | 2024 | 2023 | ||||||||||||||
| Cash provided by continuing operating activities | $ | 341.7 | $ | 232.6 | $ | 74.2 | |||||||||||
| Cash (required) provided by continuing investing activities | (1,843.1) | (41.3) | 729.3 | ||||||||||||||
| Cash provided (required) by continuing financing activities | 458.1 | 561.8 | (354.1) | ||||||||||||||
| Effect of foreign exchange rate changes on cash, cash equivalents and restricted cash | 1.4 | (9.0) | (1.2) | ||||||||||||||
| Net (decrease) increase in cash from continuing operations | $ | (1,041.9) | $ | 744.1 | $ | 448.2 | |||||||||||
49
2025 Compared with 2024
Cash provided by continuing operating activities in 2025 was $341.7 million, representing a $109.1 million increase compared to 2024. The increase was driven primarily by higher non-cash reconciling items for depreciation and amortization, pension and other post-retirement benefits expense resulting from the settlement of the U.S. qualified defined benefit plan, deferred income taxes, inventory step-up amortization, debt issuance cost amortization, and stock-based compensation expense. The increase was partially offset by an increase in working capital balances from the acquired Marel business.
Cash required by continuing investing activities during 2025 was $1,843.1 million, compared to cash required of $41.3 million in 2024. The cash outflow during 2025 was primarily due to the acquisition of Marel.
Cash provided by continuing financing activities of $458.1 million in 2025, was primarily comprised of net proceeds from the funding of the Term Loan B and the issuance of the convertible notes, bond hedge, and warrant transactions, partially offset by net repayments on the revolving credit facility and the payment of debt issuance costs related to the Second A&R Credit Agreement and its subsequent amendments. Cash provided by financing activities of $561.8 million in 2024 primarily consisted of net proceeds from the fourth quarter draw on our revolving credit facility, partially offset by the payment of debt issuance costs related to the amended revolving credit facility and Term Loan B secured during the fourth quarter of 2024, and the Bridge Credit Agreement entered into during the second quarter of 2024.
Financing Arrangements
As of December 31, 2025 we had $37.6 million drawn on and $1,756.4 million of availability under the revolving credit facility.
Our Second A&R Credit Agreement includes restrictive covenants that, if not met, could lead to a renegotiation of our credit lines, a requirement to repay our borrowings and/or a significant increase in our cost of financing. Restrictive covenants include a minimum interest coverage ratio, a maximum leverage ratio, as well as certain events of default. As of December 31, 2025, we were in compliance with all covenants in the Second A&R Credit Agreement. We expect to remain in compliance with all covenants.
On January 2, 2025, we executed takeout financing consisting of an amended and restated 5-year, $1.8 billion revolving credit facility and a 7-year, $900 million senior secured term loan B. Through the second quarter of 2025, the amended revolving credit facility retained the same pricing grid as our previous revolving credit facility. During the third quarter of 2025, we amended the Second A&R
Credit Agreement, revising the pricing grid on the revolving credit facility. Through the second quarter of 2025, the Term Loan B provided for secured pricing of SOFR plus 225 basis points. During the third quarter of 2025, we amended the Second A&R Credit Agreement to provide for secured pricing of SOFR plus 175 basis points.
On September 9, 2025, we closed a private offering of $575.0 million aggregate principal amount of the 2030 Notes to qualified institutional buyers, resulting in net proceeds of approximately $562.5 million after deducting initial purchasers’ discounts. The 2030 Notes will mature on September 15, 2030 unless earlier converted, redeemed or repurchased.
On May 28, 2021, we closed a private offering of $402.5 million aggregate principal amount of the 2026 Notes to qualified institutional buyers, resulting in net proceeds to us of approximately $392.2 million after deducting initial purchasers’ discounts. The 2026 Notes will mature on May 15, 2026 unless earlier converted, redeemed or repurchased.
Concurrently with the issuances of the 2026 Notes and the 2030 Notes, we entered into convertible note hedge transactions that reduce potential dilution upon conversion of the notes and entered into warrant transactions to raise additional capital to partially offset the costs of entering into the convertible note hedge transactions.
For additional information about our credit agreement, Notes, convertible note hedge and warrant transactions, refer to Note 8. Debt of the Notes to the Consolidated Financial Statements.
As of December 31, 2025, a portion of our total gross outstanding debt of 1,910.3 million effectively remained fixed rate debt, with the 2026 Notes and the 2030 Notes subject to a fixed rate of 0.25% and 0.375%, respectively. Our revolving credit facility and Term Loan B are subject to floating, or market rates, in addition to a premium charged for their respective credit spreads. Approximately $932.8 million or 49% of the total debt balance as of December 31, 2025 was variable rate debt and subject to floating rates.
On January 3, 2025, we entered into five cross-currency swaps expiring in January 2032 related to the portion of the U.S. dollar denominated Term Loan B debt drawn down by JBT Marel’s European entity. These cross currency swap agreements have a combined notional amount of $694.8 million and synthetically swapped an average SOFR interest rate of 4.25% with an average EURIBOR rate of 2.18% for the year ended December 31, 2025, to hedge the impact of variability in exchange rates on the U.S. dollar dominated debt and related interest payments, excluding credit spread, by our euro-functional entity.
50
Critical Accounting Estimates
We prepare our consolidated financial statements in conformity with U.S. generally accepted accounting principles. As such, we are required to make certain estimates, judgments and assumptions about matters that are inherently uncertain. On an ongoing basis, our management re-evaluates these estimates, judgments and assumptions for reasonableness because of the critical impact that these factors have on the reported amounts of assets and liabilities at the dates of the financial statements and the reported amounts of revenue and expenses during the periods presented. Management has discussed the development and selection of these critical accounting estimates with the Audit Committee of our Board of Directors, and the Audit Committee has reviewed this disclosure. We believe that the following are the critical accounting estimates used in preparing our financial statements.
Goodwill
Goodwill in an acquisition represents the excess of aggregate purchase price over the fair value of identifiable net assets. We review goodwill for impairment at least annually, or more frequently when events occur or changes in circumstances indicate that impairment may have occurred. The fair value of reporting units is calculated using the discounted cash flow method to evaluate the reasonableness of the resulting fair values.
The estimates used to calculate the fair values of reporting units involve the use of significant assumptions, estimates and judgments and changes from year to year based on economic conditions, industry and market considerations, cost factors, overall financial performance of the reporting units and other entity and reporting unit specific events. Future changes in the estimates and assumptions that are used in our acquisition valuations and goodwill impairment testing, including discount rates or future operating results and related cash flow projections, could result in significantly different estimates of the fair values in the future. An increase in discount rates, a reduction in projected cash flows or a combination of the two could lead to a reduction in the estimated fair values, which may result in impairment charges that could materially affect our financial statements in any given year.
For further information on the Company’s business combinations and goodwill, refer to Note 2. Acquisitions and Note 7. Goodwill and Intangible Assets, of the Notes to the Consolidated Financial Statements.
Intangible Asset Valuation
Accounting for business combinations requires management to make significant estimates and assumptions at the acquisition date specifically for the valuation of intangible assets. We use the multi-period excess earnings method, a type of income approach, to determine the fair value of the customer relationships and the relief-from-royalty method, a type of income approach, to determine the fair value of the trademarks and acquired technology. Critical estimates and assumptions in valuing certain of the intangible assets we have acquired include, but are not limited to, forecasted revenue growth rates, adjusted EBITDA margins, discount rates, customer attrition rates and royalty rates. The discount rates used to discount expected future cash flows to present value are typically derived from a weighted-average cost of capital analysis and adjusted to reflect inherent risks. The customer attrition rate was selected based on historical experience and information obtained from Marel management. The royalty rates used in the valuation of the trademarks and acquired technology intangible assets were based on a detailed analysis considering the importance of the trademarks and technology to the overall enterprise and market royalty data.
Unanticipated events and circumstances may occur that could affect either the accuracy or validity of such assumptions, estimates or actual results. While we use our best estimates and assumptions, fair value estimates are inherently uncertain and subject to refinement. As a result, during the measurement period, which may be up to one year from the acquisition date, we may record adjustments to the assets acquired and liabilities assumed, with the corresponding offset to goodwill.
Future changes in the estimates and assumptions that are used in our acquisition valuations and intangible asset and goodwill impairment testing, including discount rates or future operating results and related cash flow projections, could result in significantly different estimates of the fair values in the future. An increase in discount rates, a reduction in projected cash flows or a combination of the two could lead to a reduction in the estimated fair values, which may result in impairment charges that could materially affect our financial statements in any given year.
For further information on the Company’s business combinations and intangible assets, refer to Note 2. Acquisitions and Note 7. Goodwill and Intangible Assets, of the Notes to the Consolidated Financial Statements.
51
Revenue Recognition
We recognize a large portion of our product revenue over time, using the “cost-to-cost” input method for contracts that provide highly customized equipment and refurbishments of customer-owned equipment for which we have an enforceable right to collect payment upon customer cancellation for performance completed to date. The input method of “cost-to-cost” to recognize revenue over time requires that we measure progress based on costs incurred to date relative to total estimated cost at completion. These cost estimates are based on assumptions and estimates to project the outcome of future events including estimated labor and material costs required to complete open projects.
Recent Accounting Pronouncements
For information with respect to recent accounting pronouncements and the impact of these pronouncements on our consolidated financial statements see Note 1. Summary of Significant Accounting Policies, of the Notes to the Consolidated Financial Statements.
52
ITEM 7A. QUANTITATIVE AND QUALITATIVE DISCLOSURES ABOUT MARKET RISK
We are subject to financial market risks, including fluctuations in foreign currency exchange rates and interest rates. In order to manage and mitigate our exposure to these risks, we may use derivative financial instruments in accordance with established policies and procedures. We do not use derivative financial instruments where the objective is to generate profits solely from trading activities. At December 31, 2025 and 2024, our derivative holdings consisted of foreign currency forward contracts and foreign currency instruments embedded in purchase and sale contracts and interest rate swap contracts.
These forward-looking disclosures address potential impacts from market risks only as they affect our financial instruments. They do not include other potential effects resulting from changes in foreign currency exchange rates, interest rates, commodity prices or equity prices that could impact our business.
Foreign Currency Exchange Rate Risk
During 2025, our foreign subsidiaries generated 62% of our revenue. Financial statements of our foreign subsidiaries for which the U.S. dollar is not the functional currency are translated into U.S. dollars. As a result, we are exposed to foreign currency translation risk.
When we sell or purchase products or services, transactions are frequently denominated in currencies other than an operation’s functional currency. As a result, we are exposed to foreign currency transaction risk. When foreign currency exposures exist, we may enter into foreign exchange forward instruments with third parties to economically hedge foreign currency exposures. Our hedging policy reduces, but does not entirely eliminate, the impact of foreign currency exchange rate movements. We do not apply hedge accounting for our foreign currency forward instruments.
We economically hedge our recognized foreign currency assets and liabilities to reduce the risk that our earnings and cash flows will be adversely affected by fluctuations in foreign currency exchange rates. We expect any gains or losses in the hedging portfolio to be substantially offset by a corresponding gain or loss in the underlying exposures being hedged. We also economically hedge firmly committed anticipated transactions in the normal course of business. As these are not offset by an underlying balance sheet position being hedged, our earnings can be significantly impacted on a periodic basis by the change in the unrealized value of these hedges.
We use a sensitivity analysis to measure the impact of an immediate 10% adverse movement in the foreign currency exchange rates. This calculation assumes that each exchange rate would change in the same direction relative to the U.S. dollar and all other variables are held constant. We expect that changes in the fair value of derivative instruments will offset the changes in fair value of the underlying assets and liabilities on the balance sheet. A 10% adverse movement in the foreign currency exchange rates would reduce the value of our derivative instruments by $1.5 million (pre-tax) as of December 31, 2025. This amount would be reflected in our net income but would be significantly offset by the changes in the fair value of the underlying hedged assets and liabilities.
In January 2025, we entered into five cross-currency swaps related to the portion of the U.S. dollar denominated Term Loan B drawn down by JBT Marel’s European entity. These cross currency swap agreements have a combined notional amount of $694.8 million and synthetically swap interest rates from SOFR to EURIBOR and hedge the impact of variability in exchange rates on the U.S. dollar dominated debt and related interest payments, excluding credit spread, by our euro-functional entity. The aggregate fair value of these swaps was a liability position of $116.6 million at December 31, 2025. We use a sensitivity analysis to measure the impact of an immediate 10% adverse movement in the foreign currency exchange rates underlying these swaps. A hypothetical 10% adverse movement in the currency exchange rates underlying these swaps from the market rate at December 31, 2025 would have resulted in a loss in value of the swaps by approximately $53.8 million.
During 2025, the Company entered into a series of cross currency swaps with an aggregate notional amount of $2.1 billion to hedge the currency exchange component of our net investments in certain of our foreign subsidiaries. The aggregate fair value of these swaps was in a liability position of $23.3 million at December 31, 2025. We use a sensitivity analysis to measure the impact of an immediate 10% movement in the foreign currency exchange rates underlying these swaps. A hypothetical adverse movement in the currency exchange rates underlying these swaps from the market rate at December 31, 2025 would have resulted in a loss in value on the swaps by $217.1 million.
53
Market Risk and Interest Rate Risk
Our borrowings from the revolving credit facility subject us to market risk associated with movements in interest rates. We had $932.8 million in variable rate debt outstanding at December 31, 2025. A hypothetical 10% adverse movement in the interest rate would increase our annual interest expense by $5.3 million.
During the second quarter of 2021, we issued $402.5 million aggregate principal amount of Convertible Senior Notes due in May 2026 (the “2026 Notes”) and during the third quarter of 2025, we issued $575.0 million aggregate principal amount of Convertible Senior Notes due in September 2030 (the “2030 Notes”, and together with the 2026 Notes, the “Notes”). We do not have economic interest rate exposure as the 2026 Notes and 2030 Notes have fixed annual rates of 0.25% and 0.375%, respectively. The fair value of the Notes is subject to interest rate risk, market risk and other factors due to its conversion feature. The fair value of the Notes is also affected by the price and volatility of our common stock and will generally increase or decrease as the market price of our common stock changes. The interest and market value changes affect the fair value of the Notes but do not impact our financial position, cash flows or results of operations due to the fixed nature of the debt obligation. Additionally, we carry the Notes at face value, less any unamortized issuance costs, on the balance sheet and present the fair value for disclosure purposes only.
54
ITEM 8. FINANCIAL STATEMENTS AND SUPPLEMENTARY DATA
Report of Independent Registered Public Accounting Firm
To the Board of Directors and Stockholders of JBT Marel Corporation
Opinions on the Financial Statements and Internal Control over Financial Reporting
We have audited the accompanying consolidated balance sheets of JBT Marel Corporation and its subsidiaries (the “Company”) as of December 31, 2025 and 2024, and the related consolidated statements of income, of comprehensive income, of changes in stockholders’ equity and of cash flows for each of the three years in the period ended December 31, 2025, including the related notes and schedule of valuation and qualifying accounts for each of the three years in the period ended December 31, 2025 listed in the index appearing under Item 15(a)(2) (collectively referred to as the “consolidated financial statements”). We also have audited the Company’s internal control over financial reporting as of December 31, 2025, based on criteria established in Internal Control - Integrated Framework (2013) issued by the Committee of Sponsoring Organizations of the Treadway Commission (COSO).
In our opinion, the consolidated financial statements referred to above present fairly, in all material respects, the financial position of the Company as of December 31, 2025 and 2024, and the results of its operations and its cash flows for each of the three years in the period ended December 31, 2025 in conformity with accounting principles generally accepted in the United States of America. Also in our opinion, the Company maintained, in all material respects, effective internal control over financial reporting as of December 31, 2025, based on criteria established in Internal Control - Integrated Framework (2013) issued by the COSO.
Basis for Opinions
The Company’s management is responsible for these consolidated financial statements, for maintaining effective internal control over financial reporting, and for its assessment of the effectiveness of internal control over financial reporting, included in Management’s Annual Report on Internal Control over Financial Reporting appearing under Item 9A. Our responsibility is to express opinions on the Company’s consolidated financial statements and on the Company’s internal control over financial reporting based on our audits. We are a public accounting firm registered with the Public Company Accounting Oversight Board (United States) (PCAOB) and are required to be independent with respect to the Company in accordance with the U.S. federal securities laws and the applicable rules and regulations of the Securities and Exchange Commission and the PCAOB.
We conducted our audits in accordance with the standards of the PCAOB. Those standards require that we plan and perform the audits to obtain reasonable assurance about whether the consolidated financial statements are free of material misstatement, whether due to error or fraud, and whether effective internal control over financial reporting was maintained in all material respects.
Our audits of the consolidated financial statements included performing procedures to assess the risks of material misstatement of the consolidated financial statements, whether due to error or fraud, and performing procedures that respond to those risks. Such procedures included examining, on a test basis, evidence regarding the amounts and disclosures in the consolidated financial statements. Our audits also included evaluating the accounting principles used and significant estimates made by management, as well as evaluating the overall presentation of the consolidated financial statements. Our audit of internal control over financial reporting included obtaining an understanding of internal control over financial reporting, assessing the risk that a material weakness exists, and testing and evaluating the design and operating effectiveness of internal control based on the assessed risk. Our audits also included performing such other procedures as we considered necessary in the circumstances. We believe that our audits provide a reasonable basis for our opinions.
As described in Management’s Annual Report on Internal Control over Financial Reporting, management has excluded Marel hf. (“Marel”) from its assessment of internal control over financial reporting as of December 31, 2025, because it was acquired by the Company in a purchase business combination during 2025. We have also excluded Marel from our audit of internal control over financial reporting. Marel is a wholly-owned subsidiary whose total assets and total revenues excluded from management’s assessment and our audit of internal control over financial reporting represent approximately 17% and 53%, respectively, of the related consolidated financial statement amounts as of and for the year ended December 31, 2025.
Definition and Limitations of Internal Control over Financial Reporting
A company’s internal control over financial reporting is a process designed to provide reasonable assurance regarding the reliability of financial reporting and the preparation of financial statements for external purposes in accordance with generally accepted accounting principles. A company’s internal control over financial reporting includes those policies and procedures that (i) pertain to the maintenance of records that, in reasonable detail, accurately and fairly reflect the transactions and dispositions of the assets of the
55
company; (ii) provide reasonable assurance that transactions are recorded as necessary to permit preparation of financial statements in accordance with generally accepted accounting principles, and that receipts and expenditures of the company are being made only in accordance with authorizations of management and directors of the company; and (iii) provide reasonable assurance regarding prevention or timely detection of unauthorized acquisition, use, or disposition of the company’s assets that could have a material effect on the financial statements.
Because of its inherent limitations, internal control over financial reporting may not prevent or detect misstatements. Also, projections of any evaluation of effectiveness to future periods are subject to the risk that controls may become inadequate because of changes in conditions, or that the degree of compliance with the policies or procedures may deteriorate.
Critical Audit Matters
The critical audit matters communicated below are matters arising from the current period audit of the consolidated financial statements that were communicated or required to be communicated to the audit committee and that (i) relate to accounts or disclosures that are material to the consolidated financial statements and (ii) involved our especially challenging, subjective, or complex judgments. The communication of critical audit matters does not alter in any way our opinion on the consolidated financial statements, taken as a whole, and we are not, by communicating the critical audit matters below, providing separate opinions on the critical audit matters or on the accounts or disclosures to which they relate.
Acquisition of Marel - Valuation of Customer Relationships, Trademarks, and Acquired Technology
As described in Note 2 to the consolidated financial statements, on January 2, 2025, the Company acquired 97.5% of the equity interests of Marel for $4,182.3 million, which is net of cash acquired of $90.0 million. On February 4, 2025, the Company acquired the remaining 2.5% of Marel’s equity interests that were not acquired on January 2, 2025 for approximately $88.7 million. Of the acquired intangible assets, $1,160.0 million of customer relationships, $230.0 million of trademarks, and $370.0 million of acquired technology were recorded. As disclosed by management, the multi-period excess earnings method, a type of income approach, was used by management to determine the fair value of the customer relationships and the relief-from-royalty method, a type of income approach, was used by management to determine the fair value of the trademarks and acquired technology. Critical estimates and assumptions in valuing certain of the intangible assets acquired include, but are not limited to, forecasted revenue growth rates, adjusted EBITDA margins, discount rates, customer attrition rates and royalty rates.
The principal considerations for our determination that performing procedures relating to the valuation of customer relationships, trademarks, and acquired technology acquired in the acquisition of Marel is a critical audit matter are (i) the significant judgment by management when developing the fair value estimate of the customer relationships, trademarks, and acquired technology; (ii) a high degree of auditor judgment, subjectivity, and effort in performing procedures and evaluating management’s significant assumptions related to the adjusted EBITDA margins, customer attrition rate, and discount rate for the customer relationships and the forecasted revenue growth rates, royalty rates, and discount rate for the trademarks and acquired technology; and (iii) the audit effort involved the use of professionals with specialized skill and knowledge.
Addressing the matter involved performing procedures and evaluating audit evidence in connection with forming our overall opinion on the consolidated financial statements. These procedures included testing the effectiveness of controls relating to the acquisition accounting, including controls over the valuation of the customer relationships, trademarks, and acquired technology. These procedures also included, among others (i) reading the purchase agreement; (ii) testing management’s process for developing the fair value estimate of the customer relationships, trademarks, and acquired technology; (iii) evaluating the appropriateness of the multi-period excess earnings and relief-from-royalty methods used by management; (iv) testing the completeness and accuracy of the underlying data used in the multi-period excess earnings and relief-from-royalty methods; and (v) evaluating the reasonableness of the significant assumptions used by management related to the adjusted EBITDA margins, customer attrition rate, and discount rate for the customer relationships and the forecasted revenue growth rates, royalty rates, and discount rate for the trademarks and acquired technology. Evaluating management’s assumptions related to the adjusted EBITDA margins and customer attrition rate for the customer relationships and the forecasted revenue growth rates for the trademarks and acquired technology involved considering (i) the current and past performance of the Marel business; (ii) the consistency with external market and industry data; and (iii) whether the assumptions were consistent with evidence obtained in other areas of the audit. Professionals with specialized skill and knowledge were used to assist in evaluating (i) the appropriateness of the multi-period excess earnings and relief-from-royalty methods and (ii) the reasonableness of the customer attrition rate and discount rate assumptions for the customer relationships and the royalty rate and discount rate assumptions for the trademarks and acquired technology.
Revenue Recognition - Product Revenue Estimated Costs at Completion
As described in Note 1 to the consolidated financial statements, management utilizes the “cost-to-cost" input method to recognize product revenue over time. During the year ended December 31, 2025, the Company recognized $1,644.6 million in revenue for over
56
time projects using the cost-to-cost method. Revenue is recognized over time for refurbishments of customer-owned equipment and for highly customized equipment for which the Company has an enforceable right to collect payment upon customer cancellation for performance completed to date. The “cost-to-cost" input method requires that management measure progress based on costs incurred to date relative to total estimated cost at completion. Cost estimates are based on assumptions and estimates to project the outcome of future events; including the estimated labor and material costs required to complete open projects.
The principal considerations for our determination that performing procedures relating to revenue recognition - product revenue estimated costs at completion is a critical audit matter are (i) the significant judgment by management when determining the estimated costs at completion and (ii) a high degree of auditor judgment, subjectivity, and effort in performing procedures and evaluating management’s significant assumptions related to estimated labor and material costs required to complete open projects.
Addressing the matter involved performing procedures and evaluating audit evidence in connection with forming our overall opinion on the consolidated financial statements. These procedures included testing the effectiveness of controls relating to the product revenue recognition process, including controls over the determination of the estimated costs at completion. These procedures also included, among others, for a sample of contracts (i) testing management’s process for determining the estimated costs at completion and (ii) evaluating the reasonableness of the significant assumptions used by management related to the estimated labor and material costs required to complete open projects. Evaluating management’s assumptions involved assessing management’s ability to reasonably estimate costs at completion by (i) testing the completeness and accuracy of underlying data used in the estimate; (ii) performing a comparison of estimated costs to actual costs incurred on similar completed contracts; (iii) evaluating the timely identification of circumstances that may warrant a modification to estimated costs at completion; and (iv) evaluating responses to inquiries with the Company’s project managers regarding the expected remaining efforts.
/s/ PricewaterhouseCoopers LLP
March 2, 2026
We have served as the Company’s auditor since 2021.
57
JBT MAREL CORPORATION
CONSOLIDATED STATEMENTS OF INCOME
| Year Ended December 31, | |||||||||||||||||
| (In millions, except per share data) | 2025 | 2024 | 2023 | ||||||||||||||
| Revenue | $ | $ | $ | ||||||||||||||
| Operating expenses: | |||||||||||||||||
| Cost of sales | |||||||||||||||||
| Selling, general and administrative expense | |||||||||||||||||
| Restructuring expense | |||||||||||||||||
| Operating income | |||||||||||||||||
| Pension expense, other than service cost | |||||||||||||||||
| Interest (income) | ( | ( | ( | ||||||||||||||
| Interest expense | |||||||||||||||||
| Loss on investment | |||||||||||||||||
| Other (income) | ( | ||||||||||||||||
| (Loss) income from continuing operations before income taxes | ( | ||||||||||||||||
| Income tax (benefit) provision | ( | ||||||||||||||||
| Equity in net earnings of unconsolidated affiliate | ( | ( | ( | ||||||||||||||
| (Loss) income from continuing operations | ( | ||||||||||||||||
| (Loss) income from discontinued operations, net of taxes | ( | ||||||||||||||||
| Net (loss) income | $ | ( | $ | $ | |||||||||||||
| Basic (loss) earnings per share from: | |||||||||||||||||
| Continuing operations | $ | ( | $ | $ | |||||||||||||
| Discontinued operations | ( | ||||||||||||||||
| Net (loss) income | $ | ( | $ | $ | |||||||||||||
| Diluted (loss) earnings per share from: | |||||||||||||||||
| Continuing operations | $ | ( | $ | $ | |||||||||||||
| Discontinued operations | ( | ||||||||||||||||
| Net (loss) income | $ | ( | $ | $ | |||||||||||||
| Weighted average shares outstanding: | |||||||||||||||||
| Basic | |||||||||||||||||
| Diluted | |||||||||||||||||
The accompanying notes are an integral part of the consolidated financial statements.
58
JBT MAREL CORPORATION
CONSOLIDATED STATEMENTS OF COMPREHENSIVE INCOME
| Year Ended December 31, | |||||||||||||||||
| (In millions) | 2025 | 2024 | 2023 | ||||||||||||||
| Net (loss) income | $ | ( | $ | $ | |||||||||||||
| Other comprehensive income (loss), net of income taxes | |||||||||||||||||
| Foreign currency translation adjustments | ( | ||||||||||||||||
| Pension and other post-retirement benefits adjustments | ( | ||||||||||||||||
| Derivatives designated as hedges | ( | ( | ( | ||||||||||||||
| Other comprehensive income (loss) | ( | ||||||||||||||||
| Comprehensive income | $ | $ | $ | ||||||||||||||
The accompanying notes are an integral part of the consolidated financial statements.
59
JBT MAREL CORPORATION
CONSOLIDATED BALANCE SHEETS
| (In millions, except per share and number of shares) | December 31, 2025 | December 31, 2024 | |||||||||
| Assets | |||||||||||
| Current Assets: | |||||||||||
| Cash and cash equivalents | $ | $ | |||||||||
| Restricted cash | |||||||||||
| Trade receivables, net of allowances | |||||||||||
| Contract assets | |||||||||||
| Inventories | |||||||||||
| Other current assets | |||||||||||
| Total current assets | |||||||||||
Property, plant and equipment, net of accumulated depreciation of $ | |||||||||||
| Goodwill | |||||||||||
| Intangible assets, net | |||||||||||
| Other assets | |||||||||||
| Total Assets | $ | $ | |||||||||
Liabilities and Stockholders’ Equity | |||||||||||
| Current Liabilities: | |||||||||||
| Short-term debt | $ | $ | |||||||||
| Accounts payable, trade and other | |||||||||||
| Advance and progress payments | |||||||||||
| Accrued payroll | |||||||||||
| Other current liabilities | |||||||||||
| Total current liabilities | |||||||||||
| Long-term debt | |||||||||||
| Accrued pension and other post-retirement benefits, less current portion | |||||||||||
| Deferred tax liabilities | |||||||||||
| Other liabilities | |||||||||||
Commitments and contingencies (Note 18) | |||||||||||
Stockholders’ Equity: | |||||||||||
Preferred stock, $ | |||||||||||
Common stock, $ | |||||||||||
Common stock held in treasury, at cost; 2025: | ( | ||||||||||
| Additional paid-in capital | |||||||||||
| Retained earnings | |||||||||||
| Accumulated other comprehensive income (loss) | ( | ||||||||||
Total stockholders’ equity | |||||||||||
Total Liabilities and Stockholders’ Equity | $ | $ | |||||||||
The accompanying notes are an integral part of the consolidated financial statements.
60
JBT MAREL CORPORATION
CONSOLIDATED STATEMENTS OF CASH FLOWS
| Year Ended December 31, | |||||||||||||||||
| (In millions) | 2025 | 2024 | 2023 | ||||||||||||||
| Cash flows from continuing operating activities: | |||||||||||||||||
| Net (loss) income | $ | ( | $ | $ | |||||||||||||
| Income from discontinued operations, net of taxes | ( | ||||||||||||||||
| Income from continuing operations | ( | ||||||||||||||||
| Adjustments to reconcile income from continuing operations to cash provided by continuing operating activities: | |||||||||||||||||
| Depreciation | |||||||||||||||||
| Amortization | |||||||||||||||||
| Stock-based compensation | |||||||||||||||||
| Pension and other post-retirement benefits expense | |||||||||||||||||
| Deferred income taxes | ( | ( | ( | ||||||||||||||
| Loss on deal contingent hedge | |||||||||||||||||
| Other | |||||||||||||||||
| Changes in operating assets and liabilities: | |||||||||||||||||
| Trade receivables, net and contract assets | ( | ( | |||||||||||||||
| Inventories | ( | ||||||||||||||||
| Accounts payable, trade and other | ( | ( | |||||||||||||||
| Advance and progress payments | ( | ||||||||||||||||
| Accrued pension and other post-retirement benefits, net | ( | ( | ( | ||||||||||||||
| Income taxes on gain from sale of AeroTech | ( | ||||||||||||||||
| Other assets and liabilities, net | |||||||||||||||||
| Cash provided by continuing operating activities | |||||||||||||||||
| Cash flows from continuing investing activities: | |||||||||||||||||
| Acquisitions, net of cash acquired | ( | ( | |||||||||||||||
| (Payments) proceeds from discontinued operations | ( | ( | |||||||||||||||
| Investment in unconsolidated affiliate | ( | ||||||||||||||||
| Capital expenditures | ( | ( | ( | ||||||||||||||
| Proceeds from disposal of assets | |||||||||||||||||
| Purchase of marketable securities | ( | ||||||||||||||||
| Proceeds from sale of marketable securities | |||||||||||||||||
| Cash (required) provided by continuing investing activities | ( | ( | |||||||||||||||
| Cash flows from continuing financing activities: | |||||||||||||||||
| Net proceeds (payments) from short-term debt | ( | ||||||||||||||||
| Repayment of domestic credit facility | ( | ( | |||||||||||||||
| Proceeds from domestic credit facility, net of debt issuance costs | |||||||||||||||||
| Proceeds from Term Loan B, net of debt issuance costs | |||||||||||||||||
| Repayment of Term Loan B | ( | ||||||||||||||||
| Proceeds from issuance of 2030 convertible senior notes, net of debt issuance costs | |||||||||||||||||
| Purchase of convertible bond hedge | ( | ||||||||||||||||
| Proceeds from sale of warrants | |||||||||||||||||
| Payment of debt issuance costs related to the Marel Transaction | ( | ( | |||||||||||||||
| Acquisition of noncontrolling interest of Marel | ( | ||||||||||||||||
| Settlement of taxes withheld on stock-based compensation awards | ( | ( | ( | ||||||||||||||
| Settlement of deal contingent hedge | ( | ||||||||||||||||
| Proceeds from settlement of cross currency swaps | |||||||||||||||||
| Common stock repurchases | ( | ||||||||||||||||
| Dividends | ( | ( | ( | ||||||||||||||
| Other | ( | ( | |||||||||||||||
| Cash provided (required) by continuing financing activities | ( | ||||||||||||||||
| Net (decrease) increase in cash from continuing operations | ( | ||||||||||||||||
| Cash flows from discontinued operations: | |||||||||||||||||
| Cash provided (required) by operating activities of discontinued operations, net | ( | ||||||||||||||||
| Cash required by investing activities of discontinued operations, net | ( | ||||||||||||||||
| Net cash provided (required) by discontinued operations | ( | ||||||||||||||||
| Effect of foreign exchange rate changes on cash, cash equivalents and restricted cash | ( | ( | |||||||||||||||
| Net increase (decrease) in cash, cash equivalents and restricted cash | $ | ( | $ | $ | |||||||||||||
61
| Year Ended December 31, | |||||||||||||||||
| (In millions) | 2025 | 2024 | 2023 | ||||||||||||||
| Cash, cash equivalents and restricted cash from continuing operations, beginning of period | $ | $ | $ | ||||||||||||||
| Add: Cash, cash equivalents and restricted cash from discontinued operations, beginning of period | |||||||||||||||||
| Add: Net increase (decrease) in cash, cash equivalents and restricted cash | ( | ||||||||||||||||
| Less: Cash, cash equivalents and restricted cash from discontinued operations, end of period | |||||||||||||||||
| Cash, cash equivalents and restricted cash from continuing operations, end of period | $ | $ | $ | ||||||||||||||
| Supplemental cash flow information for continuing operations: | |||||||||||||||||
| Interest paid | $ | $ | $ | ||||||||||||||
| Non-cash investing in capital expenditures, accrued but not paid | |||||||||||||||||
Reconciliation of cash, cash equivalents and restricted cash | |||||||||||||||||
Cash and cash equivalents | $ | $ | $ | ||||||||||||||
Restricted cash | |||||||||||||||||
Total cash, cash equivalents and restricted cash shown in the consolidated statements of cash flows | $ | $ | $ | ||||||||||||||
The accompanying notes are an integral part of the consolidated financial statements.
62
JBT MAREL CORPORATION
CONSOLIDATED STATEMENTS OF CHANGES IN STOCKHOLDERS’ EQUITY
| (In millions) | Common Stock | Common Stock Held in Treasury | Additional Paid-In Capital | Retained Earnings | Accumulated Other Comprehensive Income (Loss) | Total Equity | |||||||||||||||||||||||||||||
| December 31, 2022 | $ | $ | ( | $ | $ | $ | ( | $ | |||||||||||||||||||||||||||
| Net income | — | — | — | — | |||||||||||||||||||||||||||||||
| Issuance of treasury stock | — | ( | — | — | — | ||||||||||||||||||||||||||||||
| Share repurchases | — | ( | — | — | — | ( | |||||||||||||||||||||||||||||
Common stock cash dividends, $ | — | — | — | ( | — | ( | |||||||||||||||||||||||||||||
Foreign currency translation adjustments, net of income taxes of $ | — | — | — | — | |||||||||||||||||||||||||||||||
Derivatives designated as hedges, net of income taxes of $ | — | — | — | — | ( | ( | |||||||||||||||||||||||||||||
Pension and other post-retirement liability adjustments, net of income taxes of $ | — | — | — | — | ( | ( | |||||||||||||||||||||||||||||
| Stock-based compensation expense | — | — | — | — | |||||||||||||||||||||||||||||||
| Taxes withheld on issuance of stock-based awards | — | — | ( | — | — | ( | |||||||||||||||||||||||||||||
| December 31, 2023 | ( | ( | |||||||||||||||||||||||||||||||||
| Net income | — | — | — | — | |||||||||||||||||||||||||||||||
| Issuance of treasury stock | — | ( | — | — | — | ||||||||||||||||||||||||||||||
Common stock cash dividends, $ | — | — | — | ( | — | ( | |||||||||||||||||||||||||||||
Foreign currency translation adjustments | — | — | — | — | ( | ( | |||||||||||||||||||||||||||||
Derivatives designated as hedges, net of income taxes of $ | — | — | — | — | ( | ( | |||||||||||||||||||||||||||||
Pension and other post-retirement liability adjustments, net of income taxes of $( | — | — | — | — | |||||||||||||||||||||||||||||||
| Stock-based compensation expense | — | — | — | — | |||||||||||||||||||||||||||||||
| Taxes withheld on issuance of stock-based awards | — | — | ( | — | — | ( | |||||||||||||||||||||||||||||
| December 31, 2024 | ( | ( | |||||||||||||||||||||||||||||||||
| Net loss | — | — | — | ( | — | ( | |||||||||||||||||||||||||||||
| Issuance of common stock | — | — | — | ||||||||||||||||||||||||||||||||
| Issuance of treasury stock | — | ( | — | — | — | ||||||||||||||||||||||||||||||
Common stock cash dividends, $ | — | — | — | ( | — | ( | |||||||||||||||||||||||||||||
Foreign currency translation adjustments, net of income taxes of $ | — | — | — | — | |||||||||||||||||||||||||||||||
Derivatives designated as hedges, net of income taxes of $ | — | — | — | — | ( | ( | |||||||||||||||||||||||||||||
Pension and other post-retirement liability adjustments, net of income taxes of $( | — | — | — | — | |||||||||||||||||||||||||||||||
Proceeds from sale of warrants | — | — | — | — | |||||||||||||||||||||||||||||||
Purchase of convertible bond hedge, net of income tax of $ | — | — | ( | — | — | ( | |||||||||||||||||||||||||||||
| Stock-based compensation expense | — | — | — | — | |||||||||||||||||||||||||||||||
| Taxes withheld on issuance of stock-based awards | — | — | ( | — | — | ( | |||||||||||||||||||||||||||||
| Other | — | — | — | — | |||||||||||||||||||||||||||||||
| December 31, 2025 | $ | $ | — | $ | $ | $ | $ | ||||||||||||||||||||||||||||
The accompanying notes are an integral part of the consolidated financial statements.
63
JBT MAREL CORPORATION
NOTES TO CONSOLIDATED FINANCIAL STATEMENTS
NOTE 1. SUMMARY OF SIGNIFICANT ACCOUNTING POLICIES
Consolidation
The consolidated financial statements include the accounts of JBT Marel Corporation (JBT Marel, we, or the Company) and all wholly-owned subsidiaries. All intercompany investments, accounts, and transactions have been eliminated. On January 2, 2025, the Company changed its name from John Bean Technologies Corporation to JBT Marel Corporation.
Revision of Previously Issued Financial Statements
In the third quarter of 2025, the Company identified and corrected certain errors relating to the presentation of its Statements of Cash Flows specific to financing activities. The Company improperly reported revolving credit facility cash activity on a net basis, resulting in an understatement of gross repayments and borrowings for the revolving credit facility for the year ended December 31, 2023, as detailed below.
| (In millions) | Year Ended December 31, 2023 | ||||||||||||||||
| Consolidated Statement of Cash Flows | As Reported | Adjustment | As Revised | ||||||||||||||
| Repayment of domestic credit facility | $ | ( | $ | ( | |||||||||||||
| Proceeds from domestic credit facility, net of debt issuance costs | $ | $ | |||||||||||||||
| Net proceeds (payments) from domestic credit facilities, net of debt issuance cost | $ | ( | $ | ||||||||||||||
| Cash (required) provided by continuing financing activities | $ | ( | $ | ( | |||||||||||||
The cash flows presented for the year ended December 31, 2024 were properly stated. Management determined this error did not have any impact on the total net cash provided (required) by continuing financing activities line on the Statement of Cash Flows for any of the revised periods, and were not material to the Company’s financial statements for the periods impacted.
Strategic Acquisition of Marel hf.
On January 2, 2025, the Company completed the acquisition of Marel. Refer to Note 2. Acquisitions for additional information on the acquisition of Marel.
Business Segments
Following the acquisition of Marel on January 2, 2025, the Company determined that it had two reportable segments: the legacy pre-acquisition operations of JBT and the legacy pre-acquisition operations of Marel, which were comprised of the legacy operations of each business. During the fourth quarter of 2025, the Company realigned its reportable segments to better reflect the continued integration of its operating model. The Company operates through two reportable segments: Protein Solutions and Prepared Food and Beverage Solutions. Refer to Note 20. Business Segments for additional information.
Discontinued Operations
On August 1, 2023, the Company completed the sale of its former AeroTech business segment (“AeroTech”) to Oshkosh Corporation, a Wisconsin corporation (the “Purchaser”). All prior period financial results from the operations of AeroTech have been presented as discontinued operations. Amounts pertaining to results of operations, financial condition and cash flows throughout the document are from the Company’s continuing operations unless otherwise noted. Refer to Note 3, Discontinued Operations for further information.
Use of estimates
Preparation of financial statements that follow U.S. GAAP requires management to make estimates and judgments that affect the reported amounts of assets and liabilities and the disclosure of contingent assets and liabilities at the date of the financial statements, and the reported amounts of revenues and expenses during the reporting period. Actual results could differ from these estimates.
Cash and cash equivalents
64
Restricted Cash
Restricted cash is recorded at fair value (Level 1 fair value measurement) and consists of money market securities, intended to fund one of the Company's employee deferred compensation plans.
Marketable Securities
The Company may invest portions of its excess cash in different marketable securities. Marketable securities with original maturities of three months or more are classified as held-to-maturity debt securities. Interest income is recorded as it is earned within Interest income in the Consolidated Statements of Income.
Allowance for credit losses
Inventories
Property, plant, and equipment
Capitalized software costs
We capitalize costs incurred to purchase software or internal and external costs incurred during the application development stage of software projects. These costs are amortized on a straight-line basis over the estimated useful lives of the assets and are reflected in Selling, general and administrative expense on the Consolidated Statements of Income. For capitalized software, the useful lives range from to ten years .
65
Goodwill
Refer to Note 7. Goodwill and Intangible Assets for further details of the Company’s annual and interim goodwill impairment assessments performed in the fourth quarter of 2025.
Acquired intangible assets
Intangible assets with finite useful lives are subject to amortization on a straight-line basis over the expected period of economic benefit, which range from less than 4 years to 26 years. The Company evaluates whether events or circumstances have occurred that warrant a revision to the remaining useful lives of intangible assets. In cases where a revision is deemed appropriate, the remaining carrying amounts of the intangible assets are amortized over the revised remaining useful life.
The carrying values of intangible assets with indefinite lives are reviewed for recoverability on an annual basis, and whenever events occur or changes in circumstances indicate that impairment may have occurred. The facts and circumstances considered include an assessment of the recoverability of the cost of intangible assets from future cash flows to be derived from the use of the asset. It is not possible to predict the likelihood of any possible future impairments or, if such an impairment were to occur, the magnitude of any impairment. However, any potential impairment would be limited to the carrying value of the indefinite-lived intangible asset.
For intangible assets with indefinite lives, the Company also evaluates whether events or circumstances have occurred that warrant a revision of their useful lives from an indefinite life to finite useful life. In cases where a revision is deemed appropriate, the carrying amounts of such intangible assets are amortized over the revised finite useful life.
Long-lived assets
Long-lived assets other than goodwill and acquired indefinite-lived intangible assets are reviewed for impairment whenever events or changes in circumstances indicate that the carrying amount of the long-lived asset may not be recoverable. The carrying amount of a long-lived asset is not recoverable if it exceeds the sum of the undiscounted cash flows expected to result from the use and eventual disposition of the asset. If it is determined that an impairment loss has occurred, the loss is measured as the amount by which the carrying amount of the long-lived asset exceeds its fair value.
We have evaluated the current environment as of December 31, 2025 and the year then ended and have concluded there is no event or circumstance that has caused an impairment of our long-lived assets. We will continue to monitor the environment to determine whether the impacts to the Company represent an event or change in circumstances that may trigger a need to assess for useful life revision or impairment.
Revenue recognition
Revenue is measured based on consideration specified in a contract with a customer, and excludes any sales incentives. The Company recognizes revenue when or as it satisfies a performance obligation by transferring control of a product or service to a customer.
66
Performance Obligations & Contract Estimates
A performance obligation is a promise in a contract to transfer a distinct good or service to the customer. A contract’s transaction price is allocated to each distinct performance obligation based on its respective stand-alone selling price and recognized as revenue when, or as, the performance obligation is satisfied.
The Company’s contracts with customers often include multiple promised goods and/or services. For instance, a contract may include equipment, installation, optional warranties, periodic service calls, etc. The Company frequently has contracts for which the equipment and installation are considered a single performance obligation. In these instances the installation services are not separately identifiable as the installation goes above and beyond the basic assembly, set-up and testing and therefore significantly customizes or modifies the equipment. However, the Company also has contracts where the installation services are deemed to be separately identifiable as the nature of these services are considered basic assembly, set-up and testing, and are therefore deemed to be a separate performance obligation. This generally occurs in contracts where the Company manufactures standard equipment.
When a performance obligation is separately identifiable, as defined in ASC 606, Revenue from Contracts with Customers, the Company allocates a portion of the contract price to the obligation and recognizes it separately from the other performance obligations. Contract price allocation among multiple performance obligations is based on the relative standalone selling price of each distinct good or service in the contract. When not sold separately, an estimate of the standalone selling price is determined using expected cost plus a reasonable margin.
The timing of revenue recognition for each performance obligation is either over time as control transfers or at a point in time. The Company recognizes revenue over time for contracts that provide service over a period of time, for refurbishments of customer-owned equipment, and for highly customized equipment for which the Company has an enforceable right to collect payment upon customer cancellation for performance completed to date. Revenue generated from standard equipment, highly customized equipment contracts without an enforceable right to payment for performance completed to date, as well as aftermarket parts and a portion of aftermarket services sales, are recognized at a point in time.
The Company utilizes the “cost-to-cost” input method to recognize product revenue over time. The Company measures progress based on costs incurred to date relative to total estimated cost at completion. Incurred cost represents work performed, which corresponds with, and therefore depicts, the transfer of control to the customer. Contract costs include labor, material, and certain allocated overhead expense. Material costs are considered incurred, and therefore included in the cost-to-cost measure of progress, when they are used in manufacturing and therefore customize the asset. Cost estimates are based on assumptions and estimates to project the outcome of future events; including the estimated labor and material costs required to complete open projects. During the year, we recognized $1,644.6 million in revenue for over time projects using the cost-to-cost method.
Revenue attributable to equipment which qualifies as point in time is recognized when customers take control of the asset. For equipment where installation is separately identifiable, the Company generally determines that control transfers when the customer has obtained legal title and the risks and rewards of ownership, which is dependent upon the shipping terms within the contract. For customized equipment where installation is not separately identifiable, but where the Company does not have an enforceable right to payment for performance completed to-date, it defines control transfer as the point in time in which it is able to objectively verify that the customer has the capability of full use of the asset as intended per the contract. Service revenue is recognized over time either proportionately over the period of the underlying contract or when services are complete, depending on the terms of the arrangement.
Any expected losses for a contract are charged to earnings, in total, in the period such losses are identified.
Research and development
67
Income taxes
The Company’s provision for income taxes includes amounts payable or refundable for the current year, the effects of deferred taxes and impacts from uncertain tax positions, if applicable. We establish deferred tax liabilities or assets for temporary differences between financial and tax reporting basis and subsequently adjust them to reflect changes in tax rates expected to be in effect when the temporary differences reverse. We record a valuation allowance reducing deferred tax assets when it is more likely than not that such assets will not be realized. Valuation allowances are evaluated periodically and may be subject to change in future reporting periods.
We recognize tax benefits in our financial statements from uncertain tax positions only if it is more likely than not that the tax position will be sustained based on the technical merits of the position. The amount we recognize is measured as the largest amount of benefit that is greater than 50 percent likely of being realized upon resolution. Future changes related to the expected resolution of uncertain tax positions could affect tax expense in the period when the change occurs. Interest and penalties related to underpayment of income taxes are classified as income tax expense.
We monitor for changes in tax laws and reflect the impacts of tax law changes in the period of enactment. When there is refinement to tax law changes in subsequent periods, we account for the new guidance in the period when it becomes known.
Stock-based employee compensation
The Company measures compensation cost on restricted stock awards based on the market price of common stock at the grant date and the number of shares awarded. The compensation cost for each award is recognized ratably over the lesser of the stated vesting period or the period until the employee becomes retirement eligible, after taking into account forfeitures.
Foreign currency
Financial statements of operations for which the U.S. dollar is not the functional currency are translated to the U.S. dollar prior to consolidation. Assets and liabilities are translated at the exchange rate in effect at the balance sheet date, while income statement accounts are translated at the average exchange rate for each period. For these operations, translation gains and losses are recorded as a component of accumulated other comprehensive loss in stockholders’ equity until the foreign entity is sold or liquidated.
Derivative financial instruments
The Company uses derivative financial instruments to hedge its exposures to various risks, including foreign currency exchange rate risk. The Company manufactures and sells products in a number of countries throughout the world and, as a result, the Company is exposed to movements in foreign currency exchange rates. The Company’s major foreign currency exposures involve the markets in Western Europe, South America and Asia. Some sales and purchase contracts contain embedded derivatives due to the nature of doing business in certain jurisdictions, which the Company takes into consideration as part of its risk management policy. The purpose of foreign currency hedging activities is to manage the economic impact of exchange rate volatility associated with anticipated foreign currency purchases and sales made in the normal course of business. Forward foreign exchange contracts with maturities of less than one year are primarily utilized in managing this foreign exchange rate risk. The Company does not enter into derivative financial instruments solely for speculative purposes.
Derivatives are recognized in the Consolidated Balance Sheets at fair value, with classification as current or non-current based upon the maturity of the derivative instrument. The Company does not offset fair value amounts for derivative instruments held with the same counterparty. Changes in the fair value of derivative instruments are recorded in current earnings or deferred in accumulated other comprehensive loss, depending on the type of hedging transaction and whether a derivative is designated as, and is effective as, a hedge.
In the Consolidated Statements of Income, earnings from foreign currency derivatives related to sales and remeasurement of sales-related assets, liabilities and contracts are recorded in revenue, while earnings from foreign currency derivatives related to purchases and remeasurement of purchase-related assets, liabilities and contracts are recorded in cost of products. Earnings from foreign currency derivatives related to cash management of foreign currencies throughout the world and remeasurement of cash are recorded in selling, general and administrative expenses. Changes in the fair value of deal-contingent forward contracts related to the foreign currency dominated purchase price of current or potential business combinations are recorded in selling, general and administrative expenses.
68
When hedge accounting is applied, the Company ensures that the derivative is highly effective at offsetting changes in anticipated cash flows of the hedged item or transaction. Changes in fair value of derivatives that are designated as cash flow hedges are deferred in accumulated other comprehensive income (loss) until the underlying transactions are recognized in earnings. At such time, related deferred hedging gains or losses are also recorded in earnings on the same line as the hedged item. Effectiveness is assessed at the inception of the hedge. The Company documents the risk management strategy and method for assessing hedge effectiveness at the inception of and throughout the term of each hedge.
The Company uses cross-currency swaps to hedge portions of its net investments denominated in Euro against the effect of adverse foreign exchange rate fluctuations on the translation of foreign currency balances to the U.S. dollar. The Company’s cross-currency swap agreements designated as net investment hedges for accounting purposes synthetically swap U.S. dollar denominated fixed rate debt for Euro denominated fixed rate debt. The gains or losses on these derivative instruments are included in the foreign currency translation component of other comprehensive income until the net investment is sold, diluted, or liquidated. Interest payments received for the cross currency swaps are excluded from the net investment hedge effectiveness assessment and are recorded in interest income on the Consolidated Statements of Income.
The Company uses cross-currency swaps to hedge its foreign currency exchange rate risk related to the portion of the U.S. dollar denominated Term Loan B drawn down by JBT Marel’s European entity. These cross-currency swap agreements designated as fair value hedges for accounting purposes synthetically swap interest rates from SOFR to EURIBOR and hedge the impact of variability in exchange rates on the U.S. dollar dominated debt and related interest payments, excluding the credit spread, by our euro-functional entity. The gains and losses related to the change in the fair value of the hedged components of the swaps are included in other income in the Consolidated Statements of Income and substantially offset the change in the fair value of the hedged portion of the underlying debt that is attributable to the change in euro to U.S. dollar exchange rates.
For derivatives with components excluded from the assessment of hedge effectiveness, the accumulated gains or losses recorded in accumulated other comprehensive income (loss) on such excluded components in a qualifying cash flow or net investment hedging relationship are reclassified to earnings on a systematic and rational basis over the hedge term.
Cash flows from derivative contracts are reported in the consolidated statements of cash flows in the same categories as the cash flows from the underlying transactions.
Leases
Lessee accounting
The Company leases office space, manufacturing facilities and various types of manufacturing and data processing equipment. Leases of real estate generally provide that the Company pays for repairs, property taxes and insurance. At the inception of an arrangement, the Company determines whether the arrangement is or contains a lease based on whether the contract conveys the right to control the use of identified property, plant or equipment for a period of time in exchange for consideration. Leases are classified as operating or finance leases at the commencement date of the lease. Operating leases are included in operating lease right of use (“ROU”) assets, other current liabilities, and operating lease liabilities in the Consolidated Balance Sheets, which are reported within , and , respectively. Lease liabilities are classified between current and long-term liabilities based on their payment terms. The ROU asset balance for finance leases is included in property, plant, and equipment, net in the Consolidated Balance Sheets. In accordance with the standard, the Company has elected not to recognize leases with terms of less than one year on the Consolidated Balance Sheets.
ROU assets represent the Company’s right to use an underlying asset for the lease term and lease liabilities represent an obligation to make lease payments arising from the lease. Operating lease ROU assets and liabilities are recognized at the commencement date based on the present value of lease payments over the lease term. As the implicit rate is generally not readily determinable for most of its leases, the Company uses its incremental borrowing rate at commencement date in determining the present value of lease payments. We determine the incremental borrowing rate for all leases, based on the rate of interest that the Company would have to pay to borrow an amount equal to the lease payments on a collateralized basis over a similar term. The Company uses an unsecured borrowing rate and risk-adjusts that rate to approximate a collateralized rate. The operating lease ROU asset also includes prepaid rent and reflects the unamortized balance of lease incentives. Lease expense for operating leases is recognized on a straight-line basis over the lease term.
The Company does not separate lease and non-lease components for leases other than leases of vehicles and communication equipment. For the asset categories of real estate, manufacturing, office and IT equipment, the Company accounts for the lease and non-lease components as a single lease component.
69
The Company’s leases may include renewal and termination options, which extend the lease term if the Company concludes that it is reasonably certain that it will exercise the option. The exercise of lease renewal options is at the Company’s sole discretion. Certain leases also include options to purchase the leased property. The depreciable life of the ROU assets are limited by the expected lease term, unless there is a transfer of title or purchase option reasonably certain of exercise. Our lease agreements may contain variable costs such as common area maintenance, insurance, real estate taxes or other costs. Variable lease costs are expensed as incurred on the Consolidated Statements of Income.
The Company’s lease agreements do not contain any material residual value guarantees.
Lessor accounting
The Company leases certain equipment, such as high capacity industrial extractors, to customers.
In most instances, the Company includes maintenance as a component of the lease agreement. Lease accounting requires lessors to separate lease and non-lease components and further defines maintenance as a non-lease component. The Company combines lease and non-lease components where the components meet both of the following criteria:
•The timing and pattern of transfer to the lessee of the lease and non-lease component are the same, and
•The lease component, if accounted for separately, would be classified as an operating lease.
As such, the leased asset and its respective maintenance component are accounted for as a single component.
In certain leases, consumables are included as a non-lease component. For these leases, the components do not qualify for the practical expedient as the timing and pattern of transfer to the lessee are not the same. In these instances, the non-lease component will be accounted for in accordance with ASC 606.
The Company monitors the risk associated with residual value of its leased assets. It reviews on an annual basis or more often as deemed necessary, and adjusted residual values and useful lives of equipment leased to outside parties, as appropriate. Adjustments to residual values result in an adjustment to depreciation expense. The Company’s annual review is based on a long-term view considering historical market price changes, market price trends, and expected life of the equipment.
Lease agreements with the Company’s customers do not contain any material residual value guarantees. Certain lease agreements include terms and conditions resulting in variable lease payments. These payments typically rely upon the usage of the underlying asset.
Recently Adopted Accounting Standards
In December 2023, the FASB issued ASU No. 2023-09, Improvements to Income Tax Disclosures (“ASU 2023-09”). ASU 2023-09 amends ASC 740, Income Taxes to expand income tax disclosures and requires that the Company disclose (i) the income tax rate reconciliation using both percentages and reporting currency amounts; (ii) specific categories within the income tax rate reconciliation; (iii) additional information for reconciling items that meet a quantitative threshold; (iv) the composition of state and local income taxes by jurisdiction; and (v) the amount of income taxes paid disaggregated by jurisdiction. The Company adopted ASU 2023-09 for the year ended December 31, 2025 on a prospective basis. See Note 9. Income Taxes for additional information.
Recently Issued Accounting Standards Not Yet Adopted
In November 2024, the FASB issued ASU 2024-03, Disaggregation of Income Statement Expenses (“ASU 2024-03”), that requires disclosures of disaggregated information about certain income statement expense line items on an annual and interim basis. This standard will be effective for fiscal years beginning after December 15, 2026, with early adoption permitted, and will be applied prospectively, with the option to apply retrospectively. The Company is evaluating the impact of adopting this standard and currently expects ASU 2024-03 to impact its disclosures only.
70
In July 2025, the FASB issued ASU 2025-05, Financial Instruments - Credit Losses (Topic 326) (“ASU 2025-05”), which provides a practical expedient to measure credit losses on current accounts receivable and current contract assets. The practical expedient allows companies to assume that current conditions as of the balance sheet date do not change for the remaining life of the asset when measuring credit losses. The standard will be effective for the fiscal year beginning January 1, 2026 and for interim periods beginning on and after January 1, 2026, with early adoption permitted. The Company does not expect ASU 2025-05 to have a material impact on its financial statements.
In September 2025, the FASB issued ASU 2025-06, Intangibles - Goodwill and Other - Internal-Use Software (Subtopic 350-40) (“ASU 2025-06”). The amendment modernizes the recognition and disclosure framework for internal-use software costs, removing the previous “development stage” model and introduces a more judgment-based approach. ASU 2025-06 will be effective for the fiscal year beginning January 1, 2028, and for interim periods beginning in that fiscal year, with early adoption permitted as of the beginning of a fiscal year. The standard may be applied prospectively, retrospectively, or through a modified prospective transition method. The Company is in the process of evaluating the impact of ASU 2025-06 on its financial statements.
NOTE 2. ACQUISITIONS
On January 2, 2025, the Company acquired 97.5 % of the equity interests of Marel (“Marel”), a public limited liability company incorporated under the laws of Iceland, for $4,182.3 million, which is net of cash acquired of $90.0 million (the “Marel Transaction”). Marel is a global provider of advanced processing equipment, systems, software and services, primarily for the poultry, meat, and fish industries, as well as a provider of processing solutions for pet food, plant-based proteins and aqua feed, with a presence in over 30 countries. The purpose of the acquisition of Marel was to create a leading and diversified global food and beverage technology solutions provider by bringing together two renowned companies with complementary product portfolios, highly respected brands, and cutting-edge technology to enable global customers to more efficiently access industry leading technology worldwide.
As part of the Marel Transaction, the Company settled Marel's outstanding debt of $867.8 million. In addition, the Company amended its existing credit facility in conjunction with the acquisition. The Second Amended and Restated Credit Agreement provides for a $1.8 billion revolving credit facility, which matures on January 2, 2030 , and a $900.0 million Senior Secured Term Loan B, which matures on January 2, 2032 . The proceeds from these facilities were used to fund the cash consideration for the acquisition and to settle the outstanding debt of Marel at the acquisition date.
The consideration transferred to Marel shareholders on the acquisition date consisted of the following:
| (In millions, except per share data and exchange rates) | |||||
| JBT shares issued to Marel shareholders | |||||
| JBT share price on January 2, 2025 | $ | ||||
| Value of JBT shares issued to Marel shareholders | $ | ||||
| Cash consideration to Marel shareholders (in €) | € | ||||
| EUR to USD Exchange Rate | 1.0353 €/$ | ||||
| Cash consideration to Marel shareholders (in $) | $ | ||||
| Settlement of Marel debt | $ | ||||
| Settlement of Marel interest rate swaps | $ | ||||
| Fair value of Marel stock options attributable to pre-combination vesting | $ | ||||
| Purchase consideration | $ | ||||
This acquisition has been accounted for as a business combination. Tangible and identifiable intangible assets acquired and liabilities assumed were recorded at their respective estimated fair values. The excess consideration over the estimated fair value of the net assets received has been recorded as goodwill. The factors that contributed to the recognition of goodwill primarily relate to acquisition-driven anticipated cost savings and revenue enhancement synergies coupled with the assembled workforce acquired. Assembled workforce is not recognized separate and apart from goodwill as it is neither separable nor contractual in nature. Goodwill created as a result of the Marel acquisition is not deductible for tax purposes.
Marel had revenue of $2,021.1 million and generated operating income of $119.4 million for the period from the acquisition date through December 31, 2025.
71
Acquisition-related transaction costs totaling $57.9 million were recorded as Selling, general and administrative expense in the Consolidated Statements of Income during the year ended December 31, 2025.
The following table summarizes the fair values recorded for the assets acquired and liabilities assumed for Marel:
| (In millions) | Preliminary Purchase Price Allocation | Measurement Period Adjustments(1) | Final Purchase Price Allocation | ||||||||||||||
| Financial assets | $ | $ | $ | ||||||||||||||
| Inventories | ( | ||||||||||||||||
| Property, plant and equipment | |||||||||||||||||
| Right-of-use assets | ( | ||||||||||||||||
| Customer relationship | ( | ||||||||||||||||
| Acquired technology | ( | ||||||||||||||||
| Trademarks | ( | ||||||||||||||||
| Deferred taxes | ( | ( | |||||||||||||||
| Financial liabilities | ( | ( | ( | ||||||||||||||
| Total identifiable net assets | $ | $ | ( | $ | |||||||||||||
| Purchase consideration | $ | $ | — | $ | |||||||||||||
Noncontrolling interest(2) | $ | $ | — | $ | |||||||||||||
| Goodwill | $ | $ | $ | ||||||||||||||
(1) During the measurement period, the Company recorded measurement period adjustments to the purchase price allocation as it obtained information and completed its valuation of certain assets and liabilities. The impact of these adjustments was reflected as a net increase in goodwill. Adjustments to the fair values of inventories, property, plant and equipment, and acquired intangible assets during the measurement period would have resulted in higher amortization expense by $2.8 million and lower amortization expense by $5.8 million during the quarters ended March 31, 2025 and June 30, 2025, respectively.
(2) The Company acquired 97.5 % of the equity interests of Marel and recognized a non-controlling interest in Marel on the acquisition date. The non-controlling interest was recognized at fair value, which was estimated based upon the trading price of the Company’s common stock on the acquisition date and the types of consideration that non-controlling interest holders were eligible to receive. The Company subsequently acquired the remaining 2.5 % of Marel’s equity interests, as described below.
The acquired intangible assets are amortized on a straight-line basis over their estimated useful lives. The intangible assets acquired have estimated useful lives of 16 years for customer relationships, 21 years for acquired technology, and 26 years for trademarks.
The allocation of the purchase price presented above was based on the fair values of the acquired assets and assumed liabilities using valuation techniques including the income, market, and cost approaches.
During the fourth quarter of 2025, the Company completed its valuation of the assets acquired and liabilities assumed and aligned certain accounting policies, including the accounting for research and development expenses. As a result, the Company recorded final adjustments to the provisional amounts as of December 31, 2025.
72
Pro forma financial information (unaudited)
The following information reflects the results of the Company’s operations for the years ended December 31, 2025 and 2024 on a pro forma basis as if the acquisition of Marel had been completed on January 1, 2024. Pro forma adjustments have been made to illustrate the impact of incremental non-recurring acquisition-related costs totaling $53.1 million, and the incremental impact on earnings of interest costs on the borrowings to acquire the company, amortization expense related to acquired intangible assets, depreciation expense related to the fair value of the acquired depreciable tangible assets, and the related tax impact associated with these adjustments.
Year Ended December 31, | |||||||||||
| (In millions, except per share data) | 2025 | 2024 | |||||||||
| Revenue | |||||||||||
| Pro forma | $ | $ | |||||||||
Income (loss) from continuing operations | |||||||||||
| Pro forma | $ | $ | ( | ||||||||
The unaudited pro forma information is provided for illustrative purposes only and does not purport to represent what the Company's consolidated results of operations would have been had the transaction actually occurred as of January 1, 2024, and does not purport to project actual consolidated results of operations.
Acquisition of non-controlling interest of Marel
On February 4, 2025, the Company acquired the remaining 2.5 % of Marel’s equity interests that were not acquired through the Marel Transaction, for approximately $88.7 million. The total purchase consideration was comprised of approximately $64.3 million in equity consideration and $24.4 million in cash consideration. This transaction was accounted for as an equity transaction and was reflected within financing activities within the Consolidated Statements of Cash Flows.
NOTE 3. DISCONTINUED OPERATIONS
As disclosed in Note 1, on August 1, 2023, the Company completed the sale of AeroTech to the Purchaser in exchange for cash consideration of $808.2 million. The Company recognized a gain on the Transaction of $443.7 million, net of $131.4 million of income taxes on the transaction, which is recognized in within the Consolidated Statements of Income for the year ended December 31, 2023. Income taxes on the transaction were reduced by $17.9 million, driven by a tax benefit allocated to discontinued operations from the sale of a subsidiary in the period ending December 31, 2023. The sale of AeroTech allowed the Company to become a pure-play food and beverage solutions provider.
In connection with the Transaction, the Company and the Purchaser entered into a Transition Services Agreement (the “TSA”) for the provision of information technology related services for 12 months and of other services for 6 months to support the transition of the AeroTech business. Services under the TSA effectively concluded in the quarter ended September 30, 2024. TSA income was recognized as services were performed, and the income earned was recorded in Selling, general and administrative expense within the Consolidated Statements of Income to offset the costs incurred to support the TSA. During the year ended December 31, 2024, the Company’s cash inflows from the Purchaser related to the TSA were $5.0 million.
73
Summarized Discontinued Operations Financial Information
The following table summarizes the results of operations classified as discontinued operations, net of taxes, in the Consolidated Statements of Income for the year ended December 31, 2023.
| (In millions) | 2023 | ||||
| Revenue | $ | ||||
| Operating expenses: | |||||
| Cost of sales | |||||
| Selling, general and administrative expense | |||||
| Operating income | |||||
| Interest expense | |||||
| Gain on sale of AeroTech | |||||
| Income from discontinued operations before income taxes | |||||
| Income tax provision | |||||
| Income from discontinued operations, net of taxes | $ | ||||
NOTE 4. INVENTORIES
Inventories as of December 31, consisted of the following:
| (In millions) | 2025 | 2024 | |||||||||
| Raw materials | $ | $ | |||||||||
| Work in process | |||||||||||
| Finished goods | |||||||||||
| Gross inventories before valuation adjustments | |||||||||||
| Valuation adjustments | ( | ( | |||||||||
| Net inventories | $ | $ | |||||||||
NOTE 5. PROPERTY, PLANT AND EQUIPMENT
Property, plant and equipment as of December 31, consisted of the following:
| (In millions) | 2025 | 2024 | |||||||||
| Land and land improvements | $ | $ | |||||||||
| Buildings | |||||||||||
| Machinery and equipment | |||||||||||
| Construction in process | |||||||||||
| Accumulated depreciation | ( | ( | |||||||||
| Property, plant and equipment, net | $ | $ | |||||||||
74
NOTE 6. OTHER ASSETS
Other assets as of December 31, consisted of the following:
| 2025 | 2024 | ||||||||||||||||||||||
| (In millions) | Carrying Amount | Accumulated Amortization | Carrying Amount | Accumulated Amortization | |||||||||||||||||||
| Capitalized software | $ | $ | $ | $ | |||||||||||||||||||
| Cloud computing arrangement implementation costs | |||||||||||||||||||||||
| Other | — | — | |||||||||||||||||||||
| Total other assets | $ | $ | $ | $ | |||||||||||||||||||
Capitalized software amortization expense was $26.9 million, $13.2 million, and $14.4 million for 2025, 2024, and 2023, respectively. Amortization expense related to cloud computing arrangement implementation costs was $4.9 million, $4.2 million, and $2.2 million for 2025, 2024, and 2023, respectively.
NOTE 7. GOODWILL AND INTANGIBLE ASSETS
Following the acquisition of Marel on January 2, 2025, we operated through two segments, JBT and Marel, which were comprised of the legacy operations of each business. During the fourth quarter of 2025, we realigned our reportable segments to better reflect the integration of our new operating model. We now operate through two reportable segments: Protein Solutions and Prepared Food and Beverage Solutions.
As a result of our segment realignment, the composition of our reporting units changed. Under ASC 350, Intangibles—Goodwill and Other, the goodwill previously assigned to the JBT and Marel reportable segments were reassigned to the new reporting units within the Protein Solutions and Prepared Food and Beverage Solutions reportable segments.
This reallocation was performed based on the relative fair value of the assets moved to the new reporting units on the realignment effective date in the fourth quarter of 2025.
The changes in the carrying amount of goodwill by reportable segment were as follows:
| (In millions) | JBT | Marel | Protein Solutions | Prepared Food and Beverage Solutions | Total | ||||||||||||||||||||||||
| Balance as of January 1, 2024 | $ | $ | $ | $ | $ | ||||||||||||||||||||||||
| Currency translation | ( | ( | |||||||||||||||||||||||||||
| Balance as of December 31, 2024 | |||||||||||||||||||||||||||||
| Acquisitions | |||||||||||||||||||||||||||||
Currency translation | |||||||||||||||||||||||||||||
Reallocation due to reorganization | ( | ( | |||||||||||||||||||||||||||
| Balance as of December 31, 2025 | $ | $ | $ | $ | $ | ||||||||||||||||||||||||
The Company completed its annual goodwill impairment test as of October 31, 2025 using a qualitative assessment and determined that it was more likely than not that the fair value of each reporting unit exceeded its carrying value, and therefore concluded that none of its goodwill was impaired. Similar conclusions were reached for all reporting units as of October 31, 2024 and 2023.
Due to the segment realignment as described above, the Company performed an interim quantitative assessment of goodwill in accordance with ASC 350 in the fourth quarter of 2025. The assessment utilized an income approach (discounted cash flow model) and compared the fair value of each reporting unit to its carrying value, including the allocated goodwill. Based on the results of this assessment, the Company determined that the fair value of each reporting unit exceeded its carrying value, and concluded that none of its goodwill was impaired on the date of realignment.
75
Intangible assets consisted of the following:
| 2025 | 2024 | ||||||||||||||||||||||
| (In millions) | Carrying Amount | Accumulated Amortization | Carrying Amount | Accumulated Amortization | |||||||||||||||||||
| Customer relationships | $ | $ | $ | $ | |||||||||||||||||||
| Patents and acquired technology | |||||||||||||||||||||||
| Trademarks | |||||||||||||||||||||||
| Indefinite lived intangibles assets | — | — | |||||||||||||||||||||
| Other | |||||||||||||||||||||||
| Total intangible assets | $ | $ | $ | $ | |||||||||||||||||||
Intangible asset amortization expense was $151.9 million, $44.6 million, and $46.1 million for 2025, 2024 and 2023, respectively. Annual amortization expense for intangible assets is estimated to be $140.5 million in 2026, $137.0 million in 2027, $134.2 million in 2028, $130.9 million in 2029, and $128.4 million in 2030.
NOTE 8. DEBT
The components of the Company’s borrowings as of December 31, were as follows:
| (In millions) | Maturity Date | 2025 | 2024 | ||||||||||||||
Revolving credit facility (1) | $ | $ | |||||||||||||||
| Less: unamortized debt issuance costs | ( | ( | |||||||||||||||
| Revolving credit facility, net | |||||||||||||||||
Senior Secured Term Loan B (2) | |||||||||||||||||
| Less: unamortized debt issuance costs | ( | ||||||||||||||||
| Senior Secured Term Loan B, net | |||||||||||||||||
2030 Convertible senior notes (3) | |||||||||||||||||
| Less: unamortized debt issuance costs | ( | ||||||||||||||||
| Convertible senior notes, net | |||||||||||||||||
2026 Convertible senior notes (4) | |||||||||||||||||
| Less: unamortized debt issuance costs | ( | ( | |||||||||||||||
| Convertible senior notes, net | |||||||||||||||||
Other (5) | |||||||||||||||||
| Total debt, including current portion | |||||||||||||||||
| Less: current portion of debt | |||||||||||||||||
| Long-term debt, net | $ | $ | |||||||||||||||
(1) Weighted-average interest rate at December 31, 2025 was 3.40 %
(2) Effective interest rate for the Term Loan B (as defined below) for the quarter ended December 31, 2025 was 5.76 %
(3) Effective interest rate for the 2030 Notes (as defined below) for the quarter ended December 31, 2025 was 0.93 %.
(4) Effective interest rate for the 2026 Notes (as defined below) for the quarter ended December 31, 2025 was 0.82 %.
(5) Overdraft facility and foreign line of credit borrowing.
The Company had access to short-term financing of $45.5 million and $8.0 million as of December 31, 2025 and December 31, 2024, respectively.
76
Components of interest expense recognized for the Senior Secured Term Loan B (the “Term Loan B”), the 0.375 % Convertible Senior Notes due 2030 (the “2030 Notes”), and the 0.25 % Convertible Senior Notes due 2026 (the “2026 Notes” and, together with the 2030 Notes, the “Notes”) were as follows:
| (In millions) | 2025 | 2024 | 2023 | ||||||||||||||
| Contractual interest expense, Term Loan B | $ | $ | $ | ||||||||||||||
| Interest cost related to amortization of issuance costs, Term Loan B | |||||||||||||||||
| Total interest expense, Term Loan B | $ | $ | $ | ||||||||||||||
| Contractual interest expense, the Notes | $ | $ | $ | ||||||||||||||
| Interest cost related to amortization of issuance costs, the Notes | |||||||||||||||||
| Total interest expense, the Notes | $ | $ | $ | ||||||||||||||
On January 2, 2025, the Company executed the Second Amended and Restated Credit Agreement (the “Second A&R Credit Agreement”), which provides for a $1.8 billion revolving credit facility that matures on January 2, 2030; provided that if (1) any of the Company’s 2026 Notes remain outstanding on the date that is 91 days prior to the maturity date of the 2026 Notes (the “Springing Maturity Date”), (2) the aggregate principal amount of the 2026 Notes outstanding on such date exceeds $100 million and (3) the sum of the aggregate availability under the revolving credit facility on such date plus the aggregate amount of unrestricted cash of the Company and its subsidiaries on such date is less than $600 million, then the maturity date with respect to the revolving credit facility shall be the Springing Maturity Date.
Under the Second A&R Credit Agreement, the Company is subject to a maximum Secured Net Leverage Ratio (as defined in the Second A&R Credit Agreement) for the first 12 months after the closing of the Marel Transaction of 5.00 to 1.00, stepping down to 4.00 to 1.00 at 12 months after the closing of the Marel Transaction and further stepping down to 3.50 to 1.00 at 18 months after the closing of the Marel Transaction. Among other things, the Second A&R Credit Agreement allows the Company the option to temporarily increase the maximum allowable Secured Net Leverage Ratio to 4.00 to 1.00 following the completion of a permitted acquisition, or a series of permitted acquisitions within a 12-month period (other than the Marel Transaction), having aggregate consideration in excess of $100 million (the “Leverage Ratio Increase Option”). If exercised, the Leverage Ratio Increase Option will remain in effect for four consecutive fiscal quarters (beginning with the quarter in which the permitted acquisition, or the last permitted acquisition in a series of permitted acquisitions for aggregate consideration in excess of $100 million, is consummated), unless revoked earlier by the Company.
The Second A&R Credit Agreement also provides that, solely with respect to the revolving credit facility thereunder, the Company is subject to an Interest Coverage Ratio (as defined in the Second A&R Credit Agreement) of not less than: (a) Consolidated EBITDA (as defined in the Second A&R Credit Agreement) to (b) Consolidated Interest Expense (as defined in the Second A&R Credit Agreement), in each case for the period of four consecutive fiscal quarters ending with the end of such fiscal quarter, all calculated for the Company and its subsidiaries on a consolidated basis, to be less than: (1) for the first 18 months after the closing date of the Marel Transaction, 2.50 to 1.00 and (2) thereafter, 3.00 to 1.00.
On September 3, 2025, the Company entered into the Second Amendment to the Second A&R Credit Agreement (the “Second Amendment”) in order to reduce the pricing applicable to the revolving credit facility. Under the Second Amendment, revolving loans bear interest, at the Company’s option, at (1) the applicable borrowing rate (i.e. SOFR or EURIBOR) (subject to a floor rate of zero), or (2) an alternate base rate (which is the greater of Wells Fargo’s Prime Rate, the Federal Funds Rate plus 0.5 %, or SOFR (subject to a floor rate of zero) plus 1.0 %), plus, in each case, a margin dependent on the leverage ratio.
The Company is required to make periodic interest payments on borrowed amounts and to pay an annual commitment fee of 15.0 to 25.0 basis points, depending on its leverage ratio, based on the unused portion of the Credit Facility. As of December 31, 2025, the Company had $37.6 million drawn on and $1,756.4 million of availability under the revolving credit facility. The ability to use this availability is limited by the leverage ratio covenant described below.
The obligations under the Credit Agreement are guaranteed by the Company’s domestic and certain foreign subsidiaries and subsequently formed or acquired subsidiaries (the “Guarantors”). The obligations under the Credit Agreement are secured by a first-priority security interest in substantially all of the Guarantor’s tangible and intangible personal property and a pledge of the capital stock of permitted borrowers and certain Guarantors.
The Company's credit facility includes restrictive covenants that, if not met, could lead to renegotiation of its credit facility, a requirement to repay its borrowings, and/or a significant increase in its cost of financing. Restrictive covenants include a minimum interest coverage ratio, a maximum leverage ratio, as well as certain events of default.
77
Senior Secured Term Loan B
On January 2, 2025, the Company entered into a $900 million Senior Secured Term Loan B under the Second A&R Credit Agreement (the “Term Loan B”), which matures on January 2, 2032. The Company is required to make quarterly principal repayments equal to 0.25 % of the initial Term Loan B.
On August 20, 2025, the Company entered into the First Amendment to the Second A&R Credit Agreement (the “First Amendment”), in order to reduce the pricing applicable to the Term Loan B. Borrowings under the Term Loan B bear interest at the greater of (1) SOFR (subject to a floor rate of zero ) or (2) a floor of 0 %, plus an applicable margin of 1.75 %.
Bridge Credit Agreement
In connection with the Marel Transaction, on April 4, 2024, the Company entered into a bridge credit agreement with certain financial institutions (the "Bridge Credit Agreement") that committed to provide the Company with secured bridge financing in an aggregate principal amount of €1.9 billion. Upon the completion of the Marel Transaction on January 2, 2025, the Bridge Credit Agreement was terminated. Accordingly, the Company fully amortized the remaining related financing costs that were capitalized as of December 31, 2024.
During 2025 and 2024, the Company recognized $12.4 million and $7.1 million, respectively, of financing costs associated with the Bridge Credit Agreement, in Interest expense in the Consolidated Statements of Income.
2030 Convertible Senior Notes
On September 9, 2025, the Company closed a private offering of $575.0 million aggregate principal amount of the Company’s 0.375 % Convertible Senior Notes due 2030 to qualified institutional buyers, resulting in net proceeds of approximately $562.5 million after deducting initial purchasers’ discounts. Interest on the 2030 Notes will accrue from September 9, 2025 and is payable semi-annually in arrears on March 15 and September 15 of each year, beginning on March 15, 2026, at a rate of 0.375 % per year. The 2030 Notes will mature on September 15, 2030 unless earlier converted, redeemed or repurchased. No sinking fund is provided for the 2030 Notes.
The initial conversion rate of the 2030 Notes is 5.3258 shares of the Company’s common stock per $1,000 principal amount of notes, which is equivalent to an initial conversion price of approximately $187.77 per share. The conversion rate of the 2030 Notes is subject to adjustment upon the occurrence of certain specified events. In addition, upon the occurrence of a make-whole fundamental change (as defined in the indenture governing the 2030 Notes (the “Indenture”)) or upon a notice of redemption, the Company will, in certain circumstances, increase the conversion rate for a holder that elects to convert its 2030 Notes in connection with such make-whole fundamental change or notice of redemption, as the case may be.
On or after September 20, 2028, the Company has the option to redeem for cash all or any portion of the 2030 Notes if the last reported sale price of the Company’s common stock has been at least 130 % of the conversion price then in effect for at least 20 trading days (whether or not consecutive) during any 30 consecutive trading day period (including the last trading day of such period) ending on, and including, the trading day immediately preceding the date on which the Company provides notice of redemption at a redemption price equal to 100 % of the principal amount of the 2030 Notes to be redeemed plus accrued and unpaid interest to, but excluding, the redemption date. If the Company redeems less than all the outstanding 2030 Notes, at least $100 million aggregate principal amount of 2030 Notes must be outstanding and not subject to redemption as of the relevant redemption notice date.
Prior to the close of business on the business day immediately preceding June 15, 2030, the 2030 Notes are convertible at the option of the holders only under the following circumstances:
•during any calendar quarter commencing after the calendar quarter ending on December 31, 2025 (and only during such calendar quarter), if the last reported sale price of the common stock for at least 20 trading days (whether or not consecutive) during a period of 30 consecutive trading days ending on, and including, the last trading day of the immediately preceding calendar quarter is greater than or equal to 130 % of the conversion price on each applicable trading day;
•during the five business day period after any ten consecutive trading day period (the “measurement period”) in which the trading price per $1,000 principal amount of 2030 Notes for each trading day of the measurement period was less than 98 % of the product of the last reported sale price of the common stock and the conversion rate on each such trading day;
•if the Company calls such 2030 Notes for redemption, at any time prior to the close of business on the scheduled trading day immediately preceding the redemption date, but only with respect to the notes called (or deemed called) for redemption; or
•upon the occurrence of certain corporate events, as specified in the Indenture.
78
At any time on or after June 15, 2030, holders may convert their 2030 Notes at their option, and in multiples of $1,000 principal amount, without regard to the foregoing circumstances. Upon conversion, the Company will pay cash up to the aggregate principal amount of the 2030 Notes and for the remainder of the Company’s conversion obligation in excess of the aggregate principal amount will pay or deliver cash, shares of common stock, or a combination of cash and shares of common stock at the Company’s election.
Upon the occurrence of a fundamental change (as defined in the Indenture), subject to certain conditions, the holders of the 2030 Notes may require the Company to repurchase for cash all or any portion of their 2030 Notes in multiples of $1,000 principal amounts, at its repurchase price, plus accrued and unpaid interest to, but excluding the repurchase date.
The 2030 Notes were not convertible during the year ended December 31, 2025 and none have been converted to date. Given the average market price of the common stock has not exceeded the exercise price since inception, there is no impact to the diluted earnings per share.
The Notes are senior unsecured obligations and rank equally in right of payment with all of the Company’s existing and unsubordinated debt and senior in right of payment to any future debt that is expressly subordinated in right of payment to the Notes.
The Notes will be effectively subordinated to any of the Company’s existing and future secured debt to the extent of the assets securing such indebtedness.
The Indenture includes customary terms and covenants, including certain events of default after which the 2030 Notes may become due and payable immediately.
The Company recognized $15.6 million of debt issuance costs associated with the 2030 Notes.
2030 Convertible Note Hedge Transactions
On September 9, 2025, the Company paid an aggregate amount of $105.6 million for convertible note hedge transactions entered into in connection with the issuance of the 2030 Notes (the “2030 Hedge Transactions”). The 2030 Hedge Transactions cover, subject to anti-dilution adjustments substantially similar to those in the 2030 Notes, approximately 3.1 million shares of the Company’s common stock, which is the same number of shares initially underlying the 2030 Notes, at a strike price of $187.77 , subject to customary adjustments. The 2030 Hedge Transactions will expire upon the maturity of the 2030 Notes, subject to earlier exercise or termination.
The 2030 Hedge Transactions are expected generally to reduce the potential dilutive effect of the conversion of the 2030 Notes and/or offset any cash payments the Company is required to make in excess of the principal amount of the converted 2030 Notes, in the event that the market price per share of the Company’s common stock, as measured under the terms of the 2030 Hedge Transactions, is greater than the 2030 Hedge Transactions strike price of $187.77 . The 2030 Hedge Transactions meet the criteria in ASC 815-40 to be classified within Stockholders’ Equity, and therefore these transactions are not revalued after their issuance.
The Company made a tax election to integrate the 2030 Notes and the 2030 Hedge Transactions. The accounting impact of this tax election makes the 2030 Hedge Transactions deductible as original issue discount interest for tax purposes over the term of the 2030 Notes, and results in a $26.9 million deferred tax asset recorded as an adjustment to Additional paid-in capital on our Consolidated Balance Sheet as of December 31, 2025 .
2026 Convertible Senior Notes
On May 28, 2021, the Company closed a private offering of $402.5 million aggregate principal amount of the Company's 0.25 % Convertible Senior Notes due 2026 (the "Notes") to qualified institutional buyers, resulting in net proceeds of approximately $392.2 million after deducting initial purchasers’ discounts of the Notes. Interest on the Notes has accrued from May 28, 2021 and is payable semi-annually in arrears on May 15 and November 15 of each year, beginning on November 15, 2021, at a rate of 0.25 % per year. The Notes will mature on May 15, 2026 unless earlier converted, redeemed or repurchased. No sinking fund is provided for the Notes.
The initial conversion rate of the Notes is 5.8958 shares of the Company's common stock per $1,000 principal amount of notes, which is equivalent to an initial conversion price of approximately $169.61 per share. The conversion rate of the Notes is subject to adjustment upon the occurrence of certain specified events. In addition, upon the occurrence of a make-whole fundamental change (as defined in the indenture governing the Notes (the "Indenture")) or upon a notice of redemption, the Company will, in certain circumstances, increase the conversion rate for a holder that elects to convert its Notes in connection with such make-whole fundamental change or notice of redemption, as the case may be.
79
On or after March 20, 2024, the Company has the option to redeem for cash all or part of the Notes, if the last reported sales price of the Company's common stock (the "common stock") has been at least 130 % of the conversion price then in effect for at least 20 trading days (whether or not consecutive), including the trading day immediately preceding the date on which the Company provides redemption notice, during any 30 consecutive trading days ending on, and including, the last trading day immediately before the date the Company sends the related redemption notice. The redemption price of each Note to be redeemed will be the principal amount of such note, plus accrued and unpaid interest to, but excluding, the redemption date. If the Company redeems less than all the outstanding Notes, at least $100 million aggregate principal amount of Notes must be outstanding and not subject to redemption as of the relevant redemption notice date.
Prior to the close of business on the business day immediately preceding February 15, 2026, the Notes are convertible at the option of the holders only under the following circumstances:
•during any calendar quarter commencing after the calendar quarter ending on September 30, 2021 (and only during such calendar quarter), if the last reported sale price of the common stock for at least 20 trading days (whether or not consecutive) during a period of 30 consecutive trading days ending on, and including, the last trading day of the immediately preceding calendar quarter is greater than or equal to 130 % of the conversion price on each applicable trading day;
•during the five business day period after any ten consecutive trading day period (the “measurement period”) in which the trading price per $1,000 principal amount of Notes for each trading day of the measurement period was less than 98 % of the product of the last reported sale price of the common stock and the conversion rate on each such trading day;
•if the Company calls such Notes for redemption, at any time prior to the close of business on the scheduled trading day immediately preceding the redemption date, but only with respect to the Notes called (or deemed called) for redemption; or
•upon the occurrence of certain corporate events, as specified in the Indenture governing the Notes.
At any time on or after February 15, 2026, holders may convert their Notes at their option, and in multiples of $1,000 principal amount, without regard to the foregoing circumstances. Upon conversion, the Company will pay cash up to the aggregate principal amount of the Notes and for the remainder of our conversion obligation in excess of the aggregate principal amount will pay or deliver cash, shares of common stock, or a combination of cash and shares of common stock at the Company’s election.
2026 Convertible Note Hedge Transactions
In conjunction with the 2026 Notes, the Company paid an aggregate amount of $65.6 million for the 2026 Convertible Note Hedge Transactions (the "2026 Hedge Transactions"). The 2026 Hedge Transactions cover, subject to anti-dilution adjustments substantially similar to those in the 2026 Notes, approximately 2.4 million shares of the Company's common stock. These are the same number of shares initially underlying the 2026 Notes, at a strike price of $169.61 , subject to customary adjustments. The 2026 Hedge Transactions will expire upon the maturity of the 2026 Notes, subject to earlier exercise or termination.
The 2026 Hedge Transactions are expected generally to reduce the potential dilutive effect of the conversion of the 2026 Notes and/or offset any cash payments the Company is required to make in excess of the principal amount of the converted 2026 Notes, in the event that the market price per share of the Company's common stock, as measured under the terms of the 2026 Hedge Transactions, is greater than the 2026 Hedge Transactions strike price of $169.61 . The 2026 Hedge Transactions meet the criteria in ASC 815-40 to be classified within Stockholders' Equity, and therefore these transactions are not revalued after their issuance.
The Company made a tax election to integrate the 2026 Notes and the 2026 Hedge Transactions. The accounting impact of this tax election makes the 2026 Hedge Transactions deductible as original issue discount interest for tax purposes over the term of the note, and resulted in a $17.1 million deferred tax asset recorded as an adjustment to Additional paid-in capital on the Balance Sheet as of December 31, 2025 and 2024.
80
Warrant Transactions
During the third quarter of 2025 and the second quarter of 2021, concurrently with entering into the 2030 Hedge Transactions and 2026 Hedge Transactions, the Company separately entered into privately-negotiated warrant transactions (the “2030 Warrant Transactions” and the “2026 Warrant Transactions”, respectively), whereby the Company sold to the counterparties warrants to acquire, collectively, subject to anti-dilution adjustments, 3.1 million and 2.4 million shares, respectively, of its common stock at an initial strike price of $283.42 per share and $240.02 per share, respectively. The Company received aggregate proceeds of $51.1 million and $29.5 million from the 2030 Warrant Transactions and the 2026 Warrant Transactions, respectively, with the counterparties, with such proceeds partially offsetting the costs of entering into the 2030 Hedge Transactions and the 2026 Hedge Transactions. The 2030 warrants expire in September 2030 and the 2026 warrants expire in August 2026.
If the market value per share of the common stock exceeds the strike price of the warrants, the warrants will have a dilutive effect on our earnings per share, unless the Company elects, subject to certain conditions, to settle the warrants in cash. The warrants meet the criteria in ASC 815-40 to be classified within Stockholders’ Equity, and therefore the warrants are not revalued after issuance.
NOTE 9. INCOME TAXES
Provision (Benefit) for Income Taxes
Domestic and foreign components of income from continuing operations before income taxes and non-controlling interests for the years ended on December 31, are shown below:
| (In millions) | 2025 | 2024 | 2023 | ||||||||||||||
| U.S. | $ | ( | $ | ( | $ | ||||||||||||
| Non-U.S. | |||||||||||||||||
| Income before income taxes | $ | ( | $ | $ | |||||||||||||
The provision for income taxes related to income from continuing operations for the years ended on December 31, consisted of:
| (In millions) | 2025 | 2024 | 2023 | ||||||||||||||
| Current: | |||||||||||||||||
| U.S. federal | $ | $ | $ | ||||||||||||||
| U.S. state and local | |||||||||||||||||
| Non-U.S. | |||||||||||||||||
| Total current | $ | $ | $ | ||||||||||||||
| Deferred: | |||||||||||||||||
| U.S. federal | $ | ( | $ | ( | $ | ( | |||||||||||
| U.S. state and local | ( | ( | ( | ||||||||||||||
| Non-U.S. | ( | ( | |||||||||||||||
| Total deferred | $ | ( | $ | ( | $ | ( | |||||||||||
| Provision for income taxes | $ | ( | $ | $ | |||||||||||||
81
The Company adopted ASU 2023-09 “Income Taxes (Topic 740): Improvements to Income Tax Disclosures” on a prospective basis, the table below provides the required disclosure pursuant to ASU 2023-09.
The effective income tax rate for the year ending December 31, 2025 was different from the statutory U.S. federal income tax rate due to the following:
| (In millions) | Dollar Value ($) | Percentage of total (%) | |||||||||
| Provision for income taxes at U.S. federal statutory tax rate | $ | ( | % | ||||||||
| State and local income tax, net of federal income tax effect | ( | ||||||||||
| Foreign tax effects | |||||||||||
| Brazil | |||||||||||
| Foreign rate differential | ( | ||||||||||
| Other | ( | ||||||||||
| Netherlands | |||||||||||
| Innovation box | ( | ||||||||||
| Loss on investment | ( | ||||||||||
| Other | ( | ||||||||||
| Other foreign jurisdictions | ( | ||||||||||
| Effect of cross-border tax laws | ( | ||||||||||
| Tax Credits: | |||||||||||
| Research and development credits | ( | ||||||||||
| Changes in valuation allowances | |||||||||||
| Non-taxable or non-deductible items: | |||||||||||
| Acquisition costs | ( | ||||||||||
| Other | ( | ||||||||||
| Changes in unrecognized tax benefits | ( | ||||||||||
| Total tax provision and effective tax rate | $ | ( | % | ||||||||
State taxes in Kansas, California, Illinois, Georgia, Florida, Wisconsin, Arkansas, and Iowa make up the majority (greater than 50 percent) of the tax effect in this category.
The effective tax rate reconciliation includes a single line item for unrecognized tax positions, which reflects changes in unrecognized tax benefits arising from tax positions taken in the current year as well as changes related to prior year tax positions, including settlements, lapses of statutes of limitations, and changes in judgment. These impacts are presented on an aggregated basis in accordance with ASU 2023-09.
The table below presents the required disclosure prior to the Company’s adoption of ASU 2023-09. The effective income tax rate for the years ending December 31, 2024 and 2023 differs from the statutory U.S. federal income tax rate due to the following:
82
| 2024 | 2023 | ||||||||||
| Statutory U.S. federal tax rate | |||||||||||
| Net difference resulting from: | |||||||||||
| Research and development tax incentives | ( | ( | |||||||||
| Foreign earnings subject to different tax rates | |||||||||||
| State income taxes | ( | ||||||||||
| Foreign tax credits | ( | ( | |||||||||
| US foreign inclusions | |||||||||||
| Stock based compensation - excess tax benefit | |||||||||||
| Remeasurement of deferred tax liability | ( | ||||||||||
| Valuation allowance | ( | ||||||||||
| Disposition of subsidiary | ( | ||||||||||
| Executive Compensation | |||||||||||
| Other | ( | ||||||||||
| Total difference | ( | ( | |||||||||
| Effective income tax rate | |||||||||||
On July 4, 2025, the United States Congress reconciliation bill commonly referred to as the One Big Beautiful Bill Act (“OBBB”) was signed into law. The Company does not expect any material changes to its financial position, operations, or existing liabilities from the enactment of OBBB. The largest impact the Company currently expects from the tax law changes included in OBBB is a reduction in U.S. research and development credits for 2025 and future years. The expected impact on the Company in 2025 is a reduction in U.S. research and development credits of $1.0 million. The Company will continue to evaluate current and future period effects of the OBBB as additional guidance and regulations are issued.
The Company files income tax returns in the U.S. and foreign jurisdictions. The Company is generally subject to examination by the IRS for years 2022 and later. In addition to the U.S., the Company has tax years that remain open and subject to examination by tax authorities in the following major taxing jurisdictions: Sweden for years after 2023, Brazil for years after 2020, and the Netherlands for years after 2020.
83
Deferred Income Taxes
Significant components of deferred tax assets and liabilities at December 31, were as follows:
| (In millions) | 2025 | 2024 | |||||||||
| Deferred tax assets attributable to: | |||||||||||
| Accrued pension and other postretirement benefits | $ | $ | |||||||||
| Accrued expenses and accounts receivable allowances | |||||||||||
| Loss carryforwards | |||||||||||
| Inventories | |||||||||||
| Stock-based compensation | |||||||||||
| Operating lease liabilities | |||||||||||
| Convertible bond | |||||||||||
| Research and development costs | |||||||||||
| Credit carryforwards | |||||||||||
| Acquisition costs | |||||||||||
| Interest expense carryforwards | |||||||||||
| Derivative instruments | |||||||||||
| Other | |||||||||||
| Total deferred tax assets | $ | $ | |||||||||
| Valuation allowance | ( | ( | |||||||||
| Deferred tax assets, net of valuation allowance | $ | $ | |||||||||
| Deferred tax liabilities attributable to: | |||||||||||
| Property, plant and equipment | |||||||||||
| Goodwill and intangibles | |||||||||||
| Right to use lease assets | |||||||||||
| Derivative instruments | |||||||||||
| Other | |||||||||||
| Total deferred tax liabilities | $ | $ | |||||||||
| Net deferred tax liabilities | $ | ( | $ | ||||||||
Included in deferred tax assets are tax benefits related to operating loss carryforwards totaling $44.5 million, comprised of US Federal ($9.6 million), US state ($8.0 million), and non-US ($26.9 million) loss carryforwards. Of this amount $24.9 million are available to offset future tax liabilities indefinitely, and $19.6 million, if unused, are set to expire at various dates starting in 2026 through 2045.
As of December 31, 2025 tax credit carryforwards totaled $18.5 million, which primarily include US federal credits of $15.2 million and U.S. state credits of $2.7 million which, if unused, are set to expire at various dates starting in 2032 through 2045.
Of the tax effected loss and credit carryforwards, approximately $31.5 million are subject to a full valuation allowance, as management has concluded that based on the available evidence, it is more likely than not that the deferred tax assets will not be fully utilized. These valuation allowances are primarily associated with operations in the United States, Iceland, Germany, Belgium, and Singapore.
The Company considers certain unremitted earnings of foreign subsidiaries indefinitely reinvested. The amount of unrecognized deferred tax liabilities associated with these earnings is approximately $2 million.
84
Income Tax Contingencies
As of December 31, 2025, the Company had unrecognized tax benefits of $16.1 million that, if recognized, would impact the Company’s effective tax rate. In 2025, the Company recorded unrecognized tax benefits related to the Marel acquisition as part of the purchase accounting, which did not impact the current year effective tax rate.
Activity related to the Company’s unrecognized tax benefits for the years ended December 31 are shown below:
| (In millions) | 2025 | 2024 | 2023 | ||||||||||||||
| Balance, beginning of period | $ | $ | $ | ||||||||||||||
| Settlements and effective settlements with tax authorities | ( | ||||||||||||||||
| Changes in balance related to tax positions taken during current period | |||||||||||||||||
| Changes in balance related to tax positions taken during prior periods | |||||||||||||||||
| Balance, end of period | $ | $ | $ | ||||||||||||||
As of December 31, 2025, we had accrued interest and penalties, net of federal income tax benefit, related to income tax contingencies of $0.6 million through income tax expense.
Cash Taxes Paid
The Company adopted ASU 2023-09 on a prospective basis for the year ended December 31, 2025. The following table presents required disclosures of income taxes paid, net of refunds received, for the year ended December 31, 2025:
| (In millions) | |||||
| U.S. federal | $ | ( | |||
| U.S. state and local | |||||
| Non-U.S. | |||||
| Brazil | |||||
| Netherlands | |||||
| Sweden | |||||
| Other foreign jurisdictions | |||||
| Total cash paid for taxes | $ | ||||
Income taxes paid for the years ended December 31, 2024 and 2023 were:
| (In millions) | 2024 | 2023 | |||||||||
| Supplemental cash flow information for continuing operations: | |||||||||||
| Income taxes paid | $ | $ | |||||||||
| Income taxes paid on gain from sale of AeroTech | |||||||||||
85
NOTE 10. PENSION AND POST-RETIREMENT AND OTHER BENEFIT PLANS
The Company sponsors nonqualified defined benefit pension plans that cover some of its U.S. employees. The plan provides defined benefits based on years of service and final average salary. The Company also sponsors a noncontributory plan that provides post-retirement life insurance benefits (“OPEB”) to some of its U.S. employees. Non-U.S. based employees are eligible to participate in either Company-sponsored or government-sponsored benefit plans to which the Company contributes. The Company also sponsors separate defined contribution plans that cover substantially all of its U.S. employees and some non-U.S. employees.
Termination of U.S. qualified defined benefit pension plan
During 2024, the Company obtained approval from its Board of Directors to settle all outstanding obligations of the U.S. qualified defined benefit pension plan (the “Plan”), through a combination of voluntary lump sum payments and the purchase of an annuity contract. During the fourth quarter of 2024, the Company recognized a settlement charge of $23.3 million from its pre-tax accumulated loss related to the Plan as a non-cash, pre-tax pension expense. On February 4, 2025, the Company completed the termination of the Plan via the purchase of an annuity contract for $178.5 million, funded entirely by the Plan assets. No additional cash contribution was required to settle the Company’s outstanding obligations and terminate the Plan.
The final settlement of the Plan triggered a remeasurement of the related plan benefit obligation and assets as of February 4, 2025. The net effect of the Plan remeasurement was an increase in the net funded status of the Plan of $3.4 million primarily due to an increase in the discount rate used to value to the pension liability and assets. Upon the termination, the Company recognized a pre-tax settlement charge of $146.9 million in Pension expense, other than service cost to recognize the remaining pre-tax accumulated other comprehensive loss related to the Plan.
The funded status of the Company’s pension plans, together with the associated balances recognized in its consolidated financial statements as of December 31, 2025 and 2024, were as follows:
| (In millions) | 2025 | 2024 | |||||||||
| Projected benefit obligation at January 1 | $ | $ | |||||||||
| Service cost | |||||||||||
| Interest cost | |||||||||||
| Actuarial (gain) loss | ( | ( | |||||||||
Plan participants’ contributions | |||||||||||
| Benefits paid | ( | ( | |||||||||
| Settlements | ( | ||||||||||
| Plan amendments | |||||||||||
| Currency translation adjustments | ( | ||||||||||
| Projected benefit obligation at December 31 | $ | $ | |||||||||
| Fair value of plan assets at January 1 | $ | $ | |||||||||
| Company contributions | |||||||||||
| Actual return on plan assets | ( | ( | |||||||||
Plan participants’ contributions | |||||||||||
| Benefits paid | ( | ( | |||||||||
| Assets contributed to 401(k) savings plan | ( | ||||||||||
| Plan amendments | |||||||||||
| Settlements | ( | ||||||||||
| Currency translation adjustments | ( | ||||||||||
| Fair value of plan assets at December 31 | $ | $ | |||||||||
| Funded status of the plans (liability) at December 31 | $ | ( | $ | ( | |||||||
| Amounts recognized in the Consolidated Balance Sheets at December 31 | |||||||||||
| Other current liabilities | ( | ( | |||||||||
| Accrued pension and other post-retirement benefits, less current portion | ( | ( | |||||||||
| Net amount recognized | $ | ( | $ | ( | |||||||
86
The liability associated with the OPEB plan included in the consolidated financial statements was $1.8 million and $1.7 million as of December 31, 2025 and 2024, respectively.
Amounts recognized in accumulated other comprehensive loss at December 31, 2025 and 2024 were, $7.8 million and $153.5 million, respectively for pensions, and $(0.4 ) million and $(0.7 ) million for the OPEB plan, respectively. These amounts were primarily unrecognized actuarial gains and losses.
The accumulated benefit obligation for all pension plans was $39.9 million and $218.3 million at December 31, 2025 and 2024, respectively. All pension plans had accumulated benefit obligations in excess of plan assets as of December 31, 2025. For the year ended December 31, 2025, accumulated benefit obligation for the pension plans decreased primarily due to the termination of the U.S. qualified defined benefit pension plan.
Pension costs (income) for the years ended December 31, were as follows:
| (In millions) | 2025 | 2024 | 2023 | ||||||||||||||
| Service cost | $ | $ | $ | ||||||||||||||
| Interest cost | |||||||||||||||||
| Expected return on plan assets | ( | ( | ( | ||||||||||||||
| Amortization of net actuarial loss | |||||||||||||||||
| Settlement charge recognized | |||||||||||||||||
| Total costs | $ | $ | $ | ||||||||||||||
OPEB plan costs were not material for the years ended December 31, 2025, 2024, and 2023.
Pre-tax changes in projected benefit obligations and plan assets recognized in other comprehensive loss during 2025 for the OPEB plan were not material and for the pension plans were as follows:
| (In millions) | Pensions | ||||
| Actuarial gain | $ | ||||
| Amortization of net actuarial loss | ( | ||||
| Net income recognized in other comprehensive income | $ | ( | |||
| Total recognized in net periodic benefit cost and other comprehensive income | $ | ||||
The Company uses a corridor approach to recognize actuarial gains and losses that result from changes in actuarial assumptions. The corridor approach defers all actuarial gains and losses resulting from changes in assumptions in other accumulated other comprehensive income (loss), such as those related to changes in the discount rate and differences between actual and expected returns on plan assets. These unrecognized gains and losses are amortized when the net gains and losses exceed 10% of the higher of the market-related value of the assets or the projected benefit obligation for each respective plan. The amortization is on a straight-line basis over the life expectancy of the plan’s participants for the frozen plans and the expected remaining service periods for the other plans.
Beginning in 2010, the U.S. defined benefit plans were frozen to new entrants and future benefit accruals for non-union participants were discontinued.
The following weighted-average assumptions were used to determine the benefit obligations for the pension plans:
| 2025 | 2024 | 2023 | |||||||||||||||
| Discount rate | |||||||||||||||||
| Rate of compensation increase | |||||||||||||||||
87
The following weighted-average assumptions were used to determine net periodic benefit cost for the pension plans:
| 2025 | 2024 | 2023 | |||||||||||||||
| Discount rate | |||||||||||||||||
| Rate of compensation increase | |||||||||||||||||
| Expected rate of return on plan assets | |||||||||||||||||
The estimate of the expected rate of return on plan assets is based primarily on the historical performance of plan assets, asset allocation, current market conditions and long-term growth expectations.
Plan assets
The Company’s pension investment strategy balances the requirements to generate returns using higher-returning assets, such as equity securities, with the need to control risk in the pension plan with less volatile assets, such as fixed-income securities. Risks include, among others, the likelihood of the pension plans being underfunded, thereby increasing their dependence on Company contributions. The assets are managed by professional investment firms and performance is evaluated against specific benchmarks.
Target asset allocations and actual allocations as of December 31, 2025 and 2024 were as follows:
| Target | 2025 | 2024 | |||||||||||||||
| Fixed income | |||||||||||||||||
| Real estate and other | |||||||||||||||||
| Cash | |||||||||||||||||
Actual pension plans’ asset holdings by category and level within the fair value hierarchy are presented in the following table:
| As of December 31, 2025 | As of December 31, 2024 | ||||||||||||||||||||||||||||||||||
| (In millions) | Total | Level 1 | Level 2 | Total | Level 1 | Level 2 | |||||||||||||||||||||||||||||
| Cash and cash equivalents | $ | $ | $ | $ | $ | $ | |||||||||||||||||||||||||||||
| Fixed income securities: | |||||||||||||||||||||||||||||||||||
Government securities(1) | |||||||||||||||||||||||||||||||||||
Corporate bonds(2) | |||||||||||||||||||||||||||||||||||
Other investments(3) | |||||||||||||||||||||||||||||||||||
| Total assets at fair value | $ | $ | $ | $ | $ | $ | |||||||||||||||||||||||||||||
Investments valued using NAV as a practical expedient(4) | |||||||||||||||||||||||||||||||||||
| Total assets | $ | $ | |||||||||||||||||||||||||||||||||
(1)Includes U.S. government securities and funds that invest primarily in U.S. government bonds, including treasury inflation protected securities.
(2)Includes funds that invest in investment grade bonds, high yield bonds and mortgage-backed fixed income securities.
(3)Includes funds that invest primarily in commodities and investments in insurance contracts held by the Company’s foreign pension plans.
(4)The Company elected the practical expedient to characterize certain new investments which are measured at net asset values (“NAV”) that have not been classified in the fair value hierarchy.
The fair value of assets classified as Level 1 is based on unadjusted quoted prices in active markets for identical assets. The fair value of assets classified as Level 2 is based on quoted prices for similar assets or based on valuations made using inputs that are either directly or indirectly observable as of the reporting date. Such inputs include net asset values reported at a minimum on a monthly basis by investment funds or contract values provided by the issuing insurance company. The Company is able to sell any of its investment funds with notice of no more than 30 days. For more information on the fair value hierarchy, see Note 16. Fair Value of Financial Instruments.
88
Contributions
The Company expects to contribute $2.9 million to its pension and other post-retirement benefit plans in 2026. The pension contributions will primarily be made to the non-U.S. pension plans. All of the contributions are expected to be in the form of cash.
Estimated future benefit payments
The following table summarizes expected benefit payments from various pension benefit plans through 2035. Actual benefit payments may differ from expected benefit payments.
| (In millions) | Pensions | ||||
| 2026 | $ | ||||
| 2027 | |||||
| 2028 | |||||
| 2029 | |||||
| 2030 | |||||
| 2031-2035 | |||||
Savings Plans
U.S. and some international employees participate in defined contribution savings plans that the Company sponsors. These plans generally provide company matching contributions on participants’ voluntary contributions and/or company non-elective contributions. Additionally, certain highly compensated employees participate in a non-qualified deferred compensation plan, which also allows for company matching contributions and company non-elective contributions on compensation in excess of the Internal Revenue Code Section 401(a) (17) limit. The expense for matching contributions was $20.1 million, $15.3 million, and $13.6 million in 2025, 2024 and 2023, respectively.
NOTE 11. ACCUMULATED OTHER COMPREHENSIVE INCOME (LOSS)
Accumulated other comprehensive income or loss (“AOCI”) represents the cumulative balance of other comprehensive income, net of tax, as of the Balance Sheet date. For the Company, AOCI is composed of adjustments related to pension and other post-retirement benefits plans, derivatives designated as hedges, and foreign currency translation adjustments. Changes in the AOCI balances for the years ended December 31, 2025 and 2024 by component are shown in the following table:
| (In millions) | Pension and Other Post-retirement Benefits(1) | Derivatives Designated as Hedges(1) | Foreign Currency Translation(1) | Total(1) | |||||||||||||||||||
| Balance as of January 1, 2024 | $ | ( | $ | $ | ( | $ | ( | ||||||||||||||||
| Other comprehensive income (loss) before reclassification | ( | ( | ( | ||||||||||||||||||||
| Amounts reclassified from accumulated other comprehensive income | ( | ||||||||||||||||||||||
| Balance as of December 31, 2024 | $ | ( | $ | $ | ( | $ | ( | ||||||||||||||||
| Other comprehensive income (loss) before reclassification | ( | ( | |||||||||||||||||||||
| Amounts reclassified from accumulated other comprehensive income | ( | ( | |||||||||||||||||||||
| Balance as of December 31, 2025 | $ | ( | $ | ( | $ | $ | |||||||||||||||||
(1) All amounts are net of income taxes.
89
Reclassification adjustments from AOCI into earnings for pension and other postretirement benefit plans for the year ended December 31, 2025 were $146.4 million of charges to pension expense, other than service cost, net of $37.6 million in income tax benefit. Reclassification adjustments for derivatives designated as hedges for the year ended December 31, 2025 were $2.4 million of benefit in interest expense, net of $0.6 million income tax provision and $10.6 million of benefit in other income, net of $2.7 million income tax provision. Reclassification adjustments for foreign currency translation related to net investment hedges for the year ended December 31, 2025 were $9.9 million of benefit in interest expense, net of $2.5 million income tax provision.
NOTE 12. STOCK-BASED COMPENSATION
The Company recorded stock-based compensation expense and related income tax effects for the years ended December 31, as follows:
| (In millions) | 2025 | 2024 | 2023 | ||||||||||||||
| Stock-based compensation expense | $ | $ | $ | ||||||||||||||
| Tax benefit recorded in consolidated statements of income | $ | $ | $ | ||||||||||||||
As of December 31, 2025, there was $27.5 million of unrecognized stock-based compensation expense for outstanding awards expected to be recognized over a weighted average period of 1.9 years.
Incentive Compensation Plan
The Company sponsors a stock-based compensation plan (the “Incentive Compensation Plan”) that provides certain incentives and awards to its officers, employees, directors and consultants. The Incentive Compensation Plan allows the Compensation and Human Resources Committee (the “Committee”) of the Board of Directors to make various types of awards to eligible individuals. Awards that may be issued include common stock, stock options, stock appreciation rights, restricted stock and stock units.
Restricted stock unit awards specify any applicable performance goals, the time and rate of vesting and such other provisions as determined by the Committee. Restricted stock units generally vest after 3 years of service, but may also vest upon a change of control as defined in the Incentive Compensation Plan. The 2017 Incentive Compensation Plan was approved by stockholders in May 2017. The 2017 Incentive Compensation Plan replaced the prior incentive compensation plan (the “2008 Incentive Compensation Plan”). The aggregate number of shares of common stock that are authorized for issuance under the 2017 Incentive Compensation Plan is (i) 1,000,000 shares, plus (ii) the number of shares of common stock that remained available for issuance under the 2008 Incentive Compensation Plan on the effective date of the 2017 Incentive Compensation Plan, plus (iii) the number of shares of common stock that were subject to outstanding awards under the 2008 Incentive Compensation Plan on the effective date of the 2017 Incentive Compensation Plan that are canceled, forfeited, returned or withheld without the issuance of shares thereunder.
Impact of Retirement on Outstanding Awards
In the event of an executive officer’s retirement from the Company upon or after attaining age 62 and a specified number of years of service, any nonvested awards remain outstanding after retirement and vest on the originally scheduled vesting date. This permits flexibility in retirement planning, permits the Company to provide an incentive for the vesting period and does not penalize employees who receive awards as incentive compensation when they retire.
90
Restricted Stock Units
A summary of the nonvested restricted stock units as of December 31, 2025 and changes during the year is presented below:
| Shares | Weighted-Average Grant-Date Fair Value | ||||||||||
| Nonvested at December 31, 2024 | $ | ||||||||||
| Granted | $ | ||||||||||
| Vested | ( | $ | |||||||||
| Forfeited | ( | $ | |||||||||
| Nonvested at December 31, 2025 | $ | ||||||||||
The Company grants time-based and performance-based restricted stock units with a vesting period of to three years
The number of shares to be issued for performance-based restricted stock units awards made in 2025, 2024, and 2023, is dependent upon performance over the three year period ending December 31st of the respective term, with respect to cumulative diluted earnings per share from continuing operations and average operating return on invested capital (ROIC). The payout for 2025 grants of performance-based units is also dependent and may increase or decrease by 20 % if the Company’s three year total shareholder return is within the top quartile or bottom quartile, respectively, of the comparator group of the Standard & Poor’s 1500 Industrial Machinery index. ROIC is defined as net income plus after tax net interest expense divided by average invested capital, which is an average of total shareholders equity plus debt plus future pension expenses held in AOCI less cash and cash equivalents. Based on results achieved in 2025, 2024, and 2023, and the forecasted amounts over the remainder of the performance period, the Company expects to issue a total of 97,830 , 78,720 , and 69,161 , shares at the vesting dates in February 2028, February 2027, and February 2026, respectively. Compensation cost has been measured in 2025 based on these expectations.
The following summarizes values for restricted stock activity in each of the years in the three year period ended December 31:
| 2025 | 2024 | 2023 | |||||||||||||||
| Weighted-average grant-date fair value of restricted stock units granted | $ | $ | $ | ||||||||||||||
| Fair value of restricted stock vested (in millions) | $ | $ | $ | ||||||||||||||
NOTE 13. STOCKHOLDERS’ EQUITY
The following is a summary of capital stock activity (in shares) for the year ended December 31, 2025:
| Common Stock Outstanding | Common Stock Held in Treasury | ||||||||||
| December 31, 2024 | |||||||||||
| Common stock issued | ( | ||||||||||
| Stock awards issued | |||||||||||
| December 31, 2025 | |||||||||||
On January 2, 2025, the Company issued 19,979,633 shares of its common stock to Marel shareholders for the Marel Transaction and Squeeze out, representing approximately 38 percent of its ownership in the combined company upon completion of the issuance.
NOTE 14. REVENUE RECOGNITION
Transaction price allocated to the remaining performance obligations
The Company has estimated that $1,372.0 million in revenue is expected to be recognized in the future periods related to remaining performance obligations from the Company’s contracts with customers outstanding as of December 31, 2025. The Company expects to complete these obligations and recognize revenue in the range of 85 % to 95 % in 2026 and the remainder after 2026.
91
Disaggregation of Revenue
In the following table, revenue is disaggregated by type of good or service and primary geographical market for each reportable segment. The table also includes a reconciliation of the disaggregated revenue to total revenue.
| December 31, | |||||||||||||||||||||||||||||||||||
2025 (1) | 2024 (1) | 2023 (1) | |||||||||||||||||||||||||||||||||
| (In millions) | Protein Solutions | Prepared Food and Beverage Solutions | Protein Solutions | Prepared Food and Beverage Solutions | Protein Solutions | Prepared Food and Beverage Solutions | |||||||||||||||||||||||||||||
| Type of Good or Service | |||||||||||||||||||||||||||||||||||
Recurring (2) | $ | $ | $ | $ | $ | $ | |||||||||||||||||||||||||||||
Non-recurring (2) | |||||||||||||||||||||||||||||||||||
| Total | $ | $ | $ | $ | $ | $ | |||||||||||||||||||||||||||||
Geographical Region (3) | |||||||||||||||||||||||||||||||||||
| U.S. and Canada | $ | $ | $ | $ | $ | $ | |||||||||||||||||||||||||||||
| Europe, Middle East and Africa | |||||||||||||||||||||||||||||||||||
| Asia Pacific | |||||||||||||||||||||||||||||||||||
| Latin America | |||||||||||||||||||||||||||||||||||
| Total | $ | $ | $ | $ | $ | $ | |||||||||||||||||||||||||||||
(1) Effective in the fourth quarter of 2025, segment revenues for the years ended December 31, 2025, 2024 and 2023 were recast to reflect the Company’s realignment of its reportable segments.
(2) Recurring revenue includes revenue from aftermarket parts and services, re-build services on customer owned equipment, operating leases of equipment, and subscription-based software applications. Non-recurring revenue includes new equipment and installation and the sale of software licenses.
(3) Geographical region represents the region in which the end customer resides.
Contract balances
The timing of revenue recognition, billings and cash collections results in trade receivables, contract assets, and advance and progress payments (contract liabilities). Contract assets exist when revenue recognition occurs prior to billings. Contract assets are transferred to trade receivables when the right to payment becomes unconditional (i.e., when receipt of the amount is dependent only on the passage of time). Conversely, the Company often receives payments from its customers before revenue is recognized, resulting in contract liabilities. These assets and liabilities are reported on the Consolidated Balance Sheets as contract assets and within advance and progress payments, respectively, on a contract-by-contract net basis at the end of each reporting period.
Contract asset and liability balances for the period were as follows:
| Balances as of | |||||||||||||||||
| (In millions) | December 31, 2025 | December 31, 2024 | December 31, 2023 | ||||||||||||||
| Contract Assets | $ | $ | $ | ||||||||||||||
| Contract Liabilities | |||||||||||||||||
92
NOTE 15. EARNINGS PER SHARE
The following table sets forth the computation of basic and diluted earnings per share (“EPS”) from net income for the respective periods and basic and diluted shares outstanding:
| (In millions, except per share data) | 2025 | 2024 | 2023 | ||||||||||||||
| Basic earnings per share: | |||||||||||||||||
| (Loss) income from continuing operations | $ | ( | $ | $ | |||||||||||||
| (Loss) income from discontinued operations, net of taxes | ( | ||||||||||||||||
| Net (loss) income | $ | ( | $ | $ | |||||||||||||
| Weighted average number of shares outstanding | |||||||||||||||||
| Basic (loss) earnings per share from: | |||||||||||||||||
| Continuing operations | $ | ( | $ | $ | |||||||||||||
| Discontinued operations | ( | ||||||||||||||||
| Net (loss) income | $ | ( | $ | $ | |||||||||||||
| Diluted (loss) earnings per share: | |||||||||||||||||
| Loss (income) from continuing operations | $ | ( | $ | $ | |||||||||||||
| Loss (income) from discontinued operations, net of tax | ( | ||||||||||||||||
| Net (loss) income | $ | ( | $ | $ | |||||||||||||
| Weighted average number of shares outstanding | |||||||||||||||||
| Effect of dilutive securities: | |||||||||||||||||
Restricted stock(1) | |||||||||||||||||
| Total shares and dilutive securities | |||||||||||||||||
| Diluted earnings per share from: | |||||||||||||||||
| Continuing operations | $ | ( | $ | $ | |||||||||||||
| Discontinued operations | ( | ||||||||||||||||
| Net (loss) income | $ | ( | $ | $ | |||||||||||||
Restricted stock shares with anti-dilutive effect excluded from the computation of diluted earnings per share(1) | |||||||||||||||||
NOTE 16. DERIVATIVE FINANCIAL INSTRUMENTS AND CREDIT RISK
Derivative financial instruments
All derivatives are recorded as assets or liabilities in the Consolidated Balance Sheets at their respective fair values. For derivatives designated as cash flow hedges, the unrealized gain or loss related to the derivatives is recorded in Other comprehensive income (loss) until the hedged transaction affects earnings. The Company assesses at inception of the hedge whether the derivative in the hedging transaction will be highly effective in offsetting changes in cash flows of the hedged item. Changes in the fair value of derivatives that do not meet the criteria for designation as a hedge are recognized in earnings.
Foreign Exchange: The Company manufactures and sells products in a number of countries throughout the world and, as a result, the Company is exposed to movements in foreign currency exchange rates. The Company’s major foreign currency exposures involve the markets in Western Europe, South America and Asia. Some sales and purchase contracts contain embedded derivatives due to the nature of doing business in certain jurisdictions, which the Company takes into consideration as part of its risk management policy. The purpose of foreign currency hedging activities is to manage the economic impact of exchange rate volatility associated with anticipated foreign currency purchases and sales made in the normal course of business. The Company primarily utilizes forward foreign exchange contracts with maturities of less than one year in managing this foreign exchange rate risk. The Company has not designated these forward foreign exchange contracts, which had a notional value at December 31, 2025 of $443.6 million, as hedges and therefore does not apply hedge accounting.
93
The fair values of our foreign currency assets are recorded within other current assets and other assets, and the fair values of foreign currency derivative liabilities are recorded within other current liabilities and other liabilities. The following table presents the fair value of foreign currency derivatives and embedded derivatives included within the Consolidated Balance Sheets:
| As of December 31, 2025 | As of December 31, 2024 | ||||||||||||||||||||||
| (In millions) | Derivative Assets | Derivative Liabilities | Derivative Assets | Derivative Liabilities | |||||||||||||||||||
| Total | $ | $ | $ | $ | |||||||||||||||||||
A master netting arrangement allows counterparties to net settle amounts owed to each other as a result of separate offsetting derivative transactions. The Company enters into master netting arrangements with its counterparties when possible to mitigate credit risk in derivative transactions by permitting it to net settle for transactions with the same counterparty. However, the Company does not net settle with such counterparties. As a result, the Company presents derivatives at their gross fair values in the Consolidated Balance Sheets.
As of December 31, 2025 and 2024, information related to these offsetting arrangements was as follows:
| (In millions) | As of December 31, 2025 | ||||||||||||||||||||||||||||
| Offsetting of Assets | |||||||||||||||||||||||||||||
| Gross Amounts of Recognized Assets | Gross Amounts Offset in the Consolidated Balance Sheets | Amount Presented in the Consolidated Balance Sheets | Amount Subject to Master Netting Agreement | Net Amount | |||||||||||||||||||||||||
| Derivatives | $ | $ | $ | $ | ( | $ | |||||||||||||||||||||||
| Offsetting of Liabilities | As of December 31, 2025 | ||||||||||||||||||||||||||||
| Gross Amounts of Recognized Liabilities | Gross Amounts Offset in the Consolidated Balance Sheets | Amount Presented in the Consolidated Balance Sheets | Amount Subject to Master Netting Agreement | Net Amount | |||||||||||||||||||||||||
| Derivatives | $ | $ | $ | $ | ( | $ | |||||||||||||||||||||||
| (In millions) | As of December 31, 2024 | ||||||||||||||||||||||||||||
| Offsetting of Assets | |||||||||||||||||||||||||||||
| Gross Amounts of Recognized Assets | Gross Amounts Offset in the Consolidated Balance Sheets | Amount Presented in the Consolidated Balance Sheets | Amount Subject to Master Netting Agreement | Net Amount | |||||||||||||||||||||||||
| $ | $ | $ | $ | ( | $ | ||||||||||||||||||||||||
| Offsetting of Liabilities | As of December 31, 2024 | ||||||||||||||||||||||||||||
| Gross Amounts of Recognized Liabilities | Gross Amounts Offset in the Consolidated Balance Sheets | Amount Presented in the Consolidated Balance Sheets | Amount Subject to Master Netting Agreement | Net Amount | |||||||||||||||||||||||||
| $ | $ | $ | $ | ( | $ | ||||||||||||||||||||||||
94
The following table presents the location and amount of the loss on foreign currency derivatives and on the remeasurement of assets and liabilities denominated in foreign currencies, as well as the net impact recognized in the Consolidated Statements of Income:
| Derivatives Not Designated as Hedging Instruments | Location of Gain (Loss) Recognized in Income | Amount of Gain (Loss) Recognized in Income | ||||||||||||||||||||||||
| (In millions) | 2025 | 2024 | 2023 | |||||||||||||||||||||||
| Foreign exchange contracts | Revenue | $ | $ | ( | $ | |||||||||||||||||||||
| Foreign exchange contracts | Cost of sales | ( | ( | |||||||||||||||||||||||
| Foreign exchange contracts | Selling, general and administrative expense | ( | ( | |||||||||||||||||||||||
| Total | $ | $ | ( | $ | ||||||||||||||||||||||
| Remeasurement of assets and liabilities in foreign currencies | ( | ( | ||||||||||||||||||||||||
| Net gain (loss) | $ | ( | $ | ( | $ | |||||||||||||||||||||
The following table presents the location and amount of the gain (loss) on derivatives that have been designated as hedging instruments in the Consolidated Statements of Income:
Derivatives Designated as Hedging Instruments | Location of Gain (Loss) Recognized in Income on Derivatives | Amount of Gain (Loss) Recognized in Income | ||||||||||||||||||||||||
| 2025 | 2024 | 2023 | ||||||||||||||||||||||||
| (In millions) | ||||||||||||||||||||||||||
Foreign currency derivatives | Other income | $ | $ | $ | ||||||||||||||||||||||
Foreign currency derivatives | Interest expense | |||||||||||||||||||||||||
Interest rate swaps | Interest expense | |||||||||||||||||||||||||
| Total gain (loss) | $ | $ | $ | |||||||||||||||||||||||
Net Investment:The Company uses cross currency swaps to hedge portions of its net investments denominated in Euro against the effect of adverse foreign exchange rate fluctuations on the translation of foreign currency balances to the U.S. dollar. The gains or losses on these derivative instruments are included in the foreign currency translation component of other comprehensive income until the net investment is sold, diluted, or liquidated. The Company elected to use the spot method to assess the effectiveness for these derivatives that are designated as net investment hedges for accounting purposes. Coupons received for the cross currency swaps are excluded from the net investment hedge effectiveness assessment and are recorded in Interest expense in the Consolidated Statements of Income. Cash flows related to coupons received on the swaps are included in operating activities in the Consolidated Statements of Cash Flows and the final exchange on the swaps will be reported in financing activities.
In July 2018, the Company entered into a series of cross currency swap agreements that synthetically swap $116.4 million of U.S. dollar denominated fixed rate debt to Euro denominated fixed rate debt. The agreements were designated as net investment hedges for accounting purposes. The agreements matured in July 2023 resulting in cash proceeds and a gain of $5.8
During the second quarter of 2025, the Company entered into a series of cross currency swap agreements that synthetically swap U.S. dollar denominated fixed rate debt to Euro denominated fixed rate debt with a notional amount of $578 million. These cross currency swaps were designated as net investment hedges with maturity dates in June 2030.
During the third quarter of 2025, the Company entered into a series of cross currency swap agreements that synthetically swap U.S. dollar denominated fixed rate debt to Euro denominated fixed rate debt with a total notional amount of $1.6 billion. These cross currency swaps were designated as net investment hedges, and $986 million of the swaps mature in June 2029 and $581 million mature in June 2031, respectively.
At December 31, 2025, the fair value of these derivatives designated as net investment hedges were recorded in the Consolidated Balance Sheets as Other liabilities of $23.3 million and as Accumulated other comprehensive income, net of tax, of $17.4 million
95
Fair Value: On January 3, 2025, the Company entered into five cross-currency swaps expiring in January 2032 related to the portion of the U.S. dollar denominated Term Loan B drawn down by JBT Marel's European entity. These cross currency swap agreements have a combined notional amount of $694.8 million and synthetically swap interest rates from SOFR to EURIBOR and hedge the impact of variability in exchange rates on the U.S. dollar dominated debt and related interest payments, excluding the credit spread, by our euro-functional entity.
The Company has designated these swaps as fair value hedges and changes in the fair value of these swaps are recognized in earnings in the period realized. The gains and losses related to the change in the fair value of the hedged components of the swaps are included in other income and substantially offset the change in the fair value of the hedged portion of the underlying debt that is attributable to the change in euro to U.S. dollar exchange rates. Changes in fair value of the swaps related to excluded components of the derivative instruments are recognized in accumulated other comprehensive income and recognized into earnings systematically over the life of the hedged instrument.
At December 31, 2025, the fair value of these derivatives designated as fair value hedges was recorded in the Consolidated Balance Sheets as Other liabilities of $116.6 million and as Accumulated other comprehensive income, net of tax, of $19.5 million.
Interest Rates: In March 2020, the Company executed four interest rate swaps with a combined notional amount of $200 million and in May 2020 the Company executed one interest rate swap with a notional amount of $50 million. These interest rate swaps fixed the interest rate applicable to certain of the Company’s variable-rate debt and swapped one-month SOFR rates for fixed rates. The Company designated these swaps as cash flow hedges and all changes in fair value of the swaps were recognized in accumulated other comprehensive income. The interest rate swaps expired during the second quarter of 2025.
At December 31, 2024, the fair value of these derivatives designated as cash flow hedges was recorded in the Consolidated Balance Sheet as other assets of $3.0 million and as accumulated other comprehensive income, net of tax, of $2.1 million.
Refer to Note 16. Fair Value of Financial Instruments, for a description of how the values of the above financial instruments are determined.
Credit risk
By their nature, financial instruments involve risk including credit risk for non-performance by counterparties. Financial instruments that potentially subject the Company to credit risk primarily consist of trade receivables and derivative contracts. The Company manages the credit risk on financial instruments by transacting only with financially secure counterparties, requiring credit approvals and establishing credit limits, and monitoring counterparties’ financial condition. The Company’s maximum exposure to credit loss in the event of non-performance by the counterparty, for all receivables and derivative contracts as of December 31, 2025, is limited to the amount outstanding on the financial instrument. Allowances for losses are established based on collectability assessments. Refer to Note 1. Summary of Significant Accounting Policies for a description of how allowance for credit loss is determined on financial assets measured at amortized cost, which includes Trade receivables, Contract assets, and non-current receivables.
NOTE 17. FAIR VALUE OF FINANCIAL INSTRUMENTS
The fair value framework requires the categorization of assets and liabilities into three levels based upon the assumptions (inputs) used to price the assets or liabilities. Level 1 provides the most reliable measure of fair value, whereas Level 3 generally requires significant management judgment. The three levels are defined as follows:
•Level 1: Unadjusted quoted prices in active markets for identical assets and liabilities that the Company can assess at the measurement date.
•Level 2: Observable inputs other than those included in Level 1 that are observable for the asset or liability, either directly or indirectly. For example, quoted prices for similar assets or liabilities in active markets or quoted prices for identical assets or liabilities in inactive markets.
•Level 3: Unobservable inputs reflecting management’s own assumptions about the inputs used in pricing the asset or liability.
96
Financial assets and financial liabilities measured at fair value on a recurring basis are as follows:
| As of December 31, 2025 | As of December 31, 2024 | ||||||||||||||||||||||||||||||||||||||||||||||
| (In millions) | Total | Level 1 | Level 2 | Level 3 | Total | Level 1 | Level 2 | Level 3 | |||||||||||||||||||||||||||||||||||||||
| Assets: | |||||||||||||||||||||||||||||||||||||||||||||||
| Investments | $ | $ | $ | $ | $ | $ | $ | $ | |||||||||||||||||||||||||||||||||||||||
| Derivatives | |||||||||||||||||||||||||||||||||||||||||||||||
| Total assets | $ | $ | $ | $ | $ | $ | $ | $ | |||||||||||||||||||||||||||||||||||||||
| Liabilities: | |||||||||||||||||||||||||||||||||||||||||||||||
| Derivatives | $ | $ | $ | $ | $ | $ | $ | $ | |||||||||||||||||||||||||||||||||||||||
| Total liabilities | $ | $ | $ | $ | $ | $ | $ | $ | |||||||||||||||||||||||||||||||||||||||
Investments represent securities held in trusts for the non-qualified deferred compensation plan and executive severance plan. Investments are classified as trading securities and are valued based on quoted prices in active markets for identical assets that the Company has the ability to access. As of December 31, 2025, $1.5 million of investments are recorded in other current assets in the Consolidated Balance Sheet related to investments that are expected to be redeemed within the next twelve months. The remaining investments are reported separately in Other assets on the Consolidated Balance Sheets. Investments include an unrealized gain of $0.1 million and $1.1 million as of December 31, 2025 and 2024, respectively.
The Company uses the income approach to measure the fair value of derivative instruments on a recurring basis. This approach calculates the present value of the future cash flow by measuring the change between the derivative contract rate and the published market indicative currency rate, multiplied by the contract notional values, and applying an appropriate discount rate as well as a factor of credit risk.
The carrying amounts of cash and cash equivalents, trade receivables and payables, as well as financial instruments included in other current assets and other current liabilities, approximate fair values because of their short-term maturities.
The carrying values and the estimated fair values of debt financial instruments as of December 31 were as follows:
| 2025 | 2024 | ||||||||||||||||||||||
| (In millions) | Carrying Value | Estimated Fair Value | Carrying Value | Estimated Fair Value | |||||||||||||||||||
| 2026 Convertible senior notes | $ | $ | $ | $ | |||||||||||||||||||
| 2030 Convertible senior notes | |||||||||||||||||||||||
| Senior Secured Term Loan B | |||||||||||||||||||||||
| Revolving credit facility, expires January 2, 2030 | |||||||||||||||||||||||
| Other | |||||||||||||||||||||||
The carrying values of the Company’s revolving credit facility recorded in long-term debt on the Balance Sheet approximate their fair values due to their variable interest rates. The fair value of the Convertible senior notes is estimated using Level 2 inputs as they are not registered securities nor listed on any securities exchange but may be traded by qualified institutional buyers.
97
NOTE 18. COMMITMENTS AND CONTINGENCIES
In the normal course of business, the Company is at times subject to pending and threatened legal actions, some for which the relief or damages sought may be substantial. Although the Company is not able to predict the outcome of such actions, after reviewing all pending and threatened actions with counsel and based on information currently available, management believes that the outcome of such actions, individually or in the aggregate, will not have a material adverse effect on results of operations or financial position. However, it is possible that the ultimate resolution of such matters, if unfavorable, may be material to results of operations in a particular future period as the time and amount of any resolution of such actions and its relationship to the future results of operations are not currently known.
Liabilities are established for pending legal claims only when losses associated with the claims are judged to be probable, and the loss can be reasonably estimated. In many lawsuits and arbitration, it is not considered probable that a liability has been incurred or not possible to estimate the ultimate or minimum amount of that liability until the case is close to resolution, in which case no liability would be recognized until that time.
Guarantees and Product Warranties
In the ordinary course of business with customers, vendors and others, the Company issues standby letters of credit, performance bonds, surety bonds and other guarantees. These financial instruments, which totaled approximately $69.9 million at December 31, 2025, represent guarantees of future performance. The Company also has provided approximately $8.8 million of bank guarantees and letters of credit to secure a portion of its existing financial obligations. The majority of these financial instruments expire within one year ; the Company expects to replace them through the issuance of new or the extension of existing letters of credit and surety bonds.
In some instances, the Company guarantees its customers’ financing arrangements. The Company is responsible for payment of any unpaid amounts but will receive indemnification from third parties for ninety percent of the contract values. In addition, the Company generally retains recourse to the equipment sold. As of December 31, 2025, the gross value of such arrangements was $3.2 million, of which the Company’s net exposure under such guarantees was $0.3 million.
The Company provides warranties of various lengths and terms to certain customers based on standard terms and conditions and negotiated agreements. The Company provides for the estimated cost of warranties at the time revenue is recognized for products where reliable, historical experience of warranty claims and costs exists. The Company also provides a warranty liability when additional specific obligations are identified. The warranty obligation reflected in other current liabilities in the Consolidated Balance Sheets is based on historical experience by product and considers failure rates and the related costs in correcting a product failure.
Warranty cost and accrual information were as follows:
| (In millions) | 2025 | 2024 | |||||||||
| Balance at beginning of year | $ | $ | |||||||||
| Expenses for new warranties | |||||||||||
| Adjustments to existing accruals | ( | ||||||||||
| Claims paid | ( | ( | |||||||||
| Added through acquisition | |||||||||||
| Translation | ( | ||||||||||
| Balance at end of year | $ | $ | |||||||||
NOTE 19. LEASES
Lessee Accounting
The components of the Company’s lease costs for the years ended December 31, were as follows:
| (In millions) | 2025 | 2024 | 2023 | ||||||||||||||
| Fixed lease cost | $ | $ | $ | ||||||||||||||
| Variable lease cost | |||||||||||||||||
| Total operating lease cost | $ | $ | $ | ||||||||||||||
98
Included within operating lease costs are short-term lease costs, which were $2.8 million, $1.1 million, and $1.4 million for the years ended December 31, 2025, 2024, and 2023, respectively, and sublease income which was immaterial for the years ended December 31, 2025, 2024, and 2023. The Company’s finance lease cost was $4.9 million for the year ended December 31, 2025, and immaterial for the years ended December 31, 2024 and 2023.
Supplemental cash flow information related to the Company’s leases for the years ended December 31, was as follows:
| (In millions) | 2025 | 2024 | 2023 | ||||||||||||||
| Operating cash flows from operating leases | $ | $ | $ | ||||||||||||||
| Right-of-use assets obtained in exchange for new operating lease liabilities | |||||||||||||||||
Supplemental balance sheet information related to the Company’s leases as of December 31, was as follows:
| (In millions) | Balance Sheet Classification | 2025 | 2024 | ||||||||||||||
| Lease ROU assets: | |||||||||||||||||
| Operating | Other assets | $ | $ | ||||||||||||||
Finance (a) | Net property, plant and equipment | ||||||||||||||||
| Total lease ROU assets | $ | $ | |||||||||||||||
| Lease liabilities: | |||||||||||||||||
| Current: | |||||||||||||||||
| Operating | Other current liabilities | $ | $ | ||||||||||||||
Finance (a) | |||||||||||||||||
| Long-term: | |||||||||||||||||
| Operating | Other liabilities | ||||||||||||||||
Finance (a) | |||||||||||||||||
| Total lease liabilities | $ | $ | |||||||||||||||
(a) Finance leases include real estate leases for which the Company is a lessee for an indefinite lease term. However, these finance leases have no lease liability outstanding as of December 31, 2025 as no amounts are due under the lease.
The following table presents the weighted-average remaining lease term and discount rates for the leases for which the Company is the lessee:
| (In millions) | 2025 | 2024 | |||||||||
| Weighted-average remaining lease term (years) | |||||||||||
| Operating leases | |||||||||||
Finance leases(a) | |||||||||||
| Weighted-average discount rate | |||||||||||
| Operating leases | |||||||||||
Finance leases(a) | |||||||||||
(a) Excludes real estate finance leases for which the Company is a lessee for an indefinite lease term and has no lease liability outstanding as of December 31, 2025.
99
The majority of ROU assets and lease liabilities, approximately 69 %, relate to real estate leases, with the remaining amount primarily comprised of vehicle leases.
Maturity of operating and finance lease liabilities as of December 31, 2025, in millions:
| (In millions) | Operating Leases | Finance Leases | |||||||||
Year 1(a) | $ | $ | |||||||||
| Year 2 | |||||||||||
| Year 3 | |||||||||||
| Year 4 | |||||||||||
| Year 5 | |||||||||||
| After Year 5 | |||||||||||
| Total lease payments | $ | $ | |||||||||
| Less: Interest on lease payments | ( | ( | |||||||||
| Present value of lease liabilities | $ | $ | |||||||||
Lessor Accounting
Operating Leases:
The following tables provide the required information regarding operating leases for which the Company is the lessor.
Operating Lease Revenue:
| (In millions) | December 31, 2025 | December 31, 2024 | December 31, 2023 | ||||||||||||||
| Fixed payment revenue | $ | $ | $ | ||||||||||||||
| Variable payment revenue | |||||||||||||||||
| Total | $ | $ | $ | ||||||||||||||
Operating Lessor Maturity Analysis as of December 31, 2025, in millions:
Year 1(a) | $ | ||||
| Year 2 | |||||
| Year 3 | |||||
| Year 4 | |||||
| Year 5 | |||||
| After Year 5 | |||||
| Total lease receivables | $ | ||||
100
Sales-Type Leases:
Sales-Type Lessor Maturity Analysis as of December 31, 2025, in millions:
Year 1(a) | $ | ||||
| Year 2 | |||||
| Year 3 | |||||
Year 4 | |||||
Year 5 | |||||
After Year 5 | |||||
| Total lease receivables | $ | ||||
Sales-type lease revenue was $3.3 million, $5.8 million, and $5.2 million for the years ended December 31, 2025, 2024, and 2023 respectively.
Our net investment in sales-type leases were classified in the Consolidated Balance Sheets as of December 31, as follows:
| (In millions) | 2025 | 2024 | |||||||||
| Trade receivables, net of allowances | $ | $ | |||||||||
| Other assets | |||||||||||
| Total | $ | $ | |||||||||
NOTE 20. BUSINESS SEGMENTS
During the fourth quarter of 2025, the Company realigned its reportable segments to better reflect the continued integration of its operating model. Giving effect to the realignment, the Company operates through two reportable segments: Protein Solutions and Prepared Food and Beverage Solutions. The Company defines its segments based on which internally reported financial information is regularly reviewed by the Chief Operating Decision Maker (CODM) to analyze financial performance, make decisions and allocate resources. Prior year segment information has been recast in these financial statements to conform to current year presentation.
•The Protein Solutions segment includes businesses that provide solutions for initial stage processing and harvesting of animal proteins, primarily focusing on poultry, pork, fish, and beef.
•The Prepared Food and Beverage Solutions segment includes businesses that offer solutions predominantly for downstream value-added preparation, preservation, and packaging of foods and beverages into ready to eat or drink products. This segment will also include capabilities for pet food, dairy, bakery, pharmaceutical and nutraceutical, and warehouse automation end markets.
The Company's Chief Executive Officer is the CODM, who assesses the segments’ performance using each segment’s Adjusted EBITDA. The CODM is not regularly provided with and does not evaluate the segments by using each segment’s total assets and therefore, each segment’s total assets are not disclosed.
101
Segment profitability measures and significant expenses
The following tables present financial information for the Company's reportable segments and significant expenses regularly provided to the CODM:
| Year Ended December 31, 2025 | |||||||||||||||||
| (In millions) | Protein Solutions | Prepared Food and Beverage Solutions | Total | ||||||||||||||
| Revenue | $ | $ | |||||||||||||||
Less: | |||||||||||||||||
| Cost of sales | |||||||||||||||||
| Research and development | |||||||||||||||||
Other segment items(1) | |||||||||||||||||
Add: | |||||||||||||||||
| Depreciation and amortization | |||||||||||||||||
| Segment Adjusted EBITDA | $ | $ | $ | ||||||||||||||
Less: | |||||||||||||||||
| Interest (income) | ( | ||||||||||||||||
| Interest expense | |||||||||||||||||
| Other (income) | ( | ||||||||||||||||
| Loss on investment | |||||||||||||||||
| Pension expense, other than service cost | |||||||||||||||||
| Restructuring related costs | |||||||||||||||||
| M&A related costs | |||||||||||||||||
| Depreciation and amortization | |||||||||||||||||
| Unallocated amounts: | |||||||||||||||||
Corporate expense(2) | |||||||||||||||||
| Income from continuing operations before income taxes | $ | ( | |||||||||||||||
| Capital expenditures | $ | ||||||||||||||||
(1) Other segment items for each reportable segment include operating expenses, which primarily consist of selling, general and administrative expenses and corporate and shared service expenses allocated to each segment based upon benefits received. Other segment items exclude the impact of restructuring, M&A and other one-time related costs as they do not reflect the ongoing operations of the underlying business.
(2) Corporate expense is primarily comprised of unallocated selling, general and administrative expenses and activity that does not meet the criteria of a reportable segment. Corporate expense excludes the impact of depreciation and amortization, restructuring, M&A and other one-time related and non-operating costs shown separately in the table above.
102
| Year Ended December 31, 2024 | |||||||||||||||||
| (In millions) | Protein Solutions | Prepared Food and Beverage Solutions | Total | ||||||||||||||
| Revenue | $ | $ | |||||||||||||||
Less: | |||||||||||||||||
| Cost of sales | |||||||||||||||||
| Research and development | |||||||||||||||||
Other segment items(1) | |||||||||||||||||
Add: | |||||||||||||||||
| Depreciation and amortization | |||||||||||||||||
| Segment Adjusted EBITDA | $ | $ | $ | ||||||||||||||
Less: | |||||||||||||||||
| Interest (income) | ( | ||||||||||||||||
| Interest expense | |||||||||||||||||
| Pension expense, other than service cost | |||||||||||||||||
| Restructuring related costs | |||||||||||||||||
| M&A related costs | |||||||||||||||||
| Depreciation and amortization | |||||||||||||||||
| Unallocated amounts: | |||||||||||||||||
Corporate expense(2) | |||||||||||||||||
| Income from continuing operations before income taxes | $ | ||||||||||||||||
| Capital expenditures | $ | ||||||||||||||||
(1) Other segment items for each reportable segment include operating expenses, which primarily consist of selling, general and administrative expenses and corporate and shared service expenses allocated to each segment based upon benefits received. Other segment items exclude the impact of restructuring, M&A and other one-time related costs as they do not reflect the ongoing operations of the underlying business.
(2) Corporate expense is primarily comprised of unallocated selling, general and administrative expenses and activity that does not meet the criteria of a reportable segment. Corporate expense excludes the impact of depreciation and amortization, restructuring, M&A and other one-time related and non-operating costs shown separately in the table above.
103
| Year Ended December 31, 2023 | |||||||||||||||||
| (In millions) | Protein Solutions | Prepared Food and Beverage Solutions | Total | ||||||||||||||
| Revenue | $ | $ | |||||||||||||||
Less: | |||||||||||||||||
| Cost of sales | |||||||||||||||||
| Research and development | |||||||||||||||||
Other segment items(1) | |||||||||||||||||
Add: | |||||||||||||||||
| Depreciation and amortization | |||||||||||||||||
| Segment Adjusted EBITDA | $ | $ | $ | ||||||||||||||
Less: | |||||||||||||||||
| Interest (income) | ( | ||||||||||||||||
| Interest expense | |||||||||||||||||
| Pension expense, other than service cost | |||||||||||||||||
| Restructuring related costs | |||||||||||||||||
| M&A related costs | |||||||||||||||||
| Depreciation and amortization | |||||||||||||||||
| Unallocated amounts: | |||||||||||||||||
Corporate expense(2) | |||||||||||||||||
| Income from continuing operations before income taxes | $ | ||||||||||||||||
| Capital expenditures | $ | ||||||||||||||||
(1) Other segment items for each reportable segment include operating expenses, which primarily consist of selling, general and administrative expenses and corporate and shared service expenses allocated to each segment based upon benefits received. Other segment items exclude the impact of restructuring, M&A and other one-time related costs as they do not reflect the ongoing operations of the underlying business.
(2) Corporate expense is primarily comprised of unallocated selling, general and administrative expenses and activity that does not meet the criteria of a reportable segment. Corporate expense excludes the impact of depreciation and amortization, restructuring, M&A and other one-time related and non-operating costs shown separately in the table above.
Geographic segment information
Geographic segment sales were identified based on the location where the Company’s products and services were delivered.
| Year Ended December 31, | |||||||||||||||||
| (In millions) | 2025 | 2024 | 2023 | ||||||||||||||
| Revenue (by location of customers): | |||||||||||||||||
| United States | $ | $ | $ | ||||||||||||||
| All other countries | |||||||||||||||||
| Total revenue | $ | $ | $ | ||||||||||||||
104
Geographic segment long-lived assets include property, plant and equipment, net and certain other non-current assets.
| Year Ended December 31, | |||||||||||
| (In millions) | 2025 | 2024 | |||||||||
| Long-lived assets: | |||||||||||
| United States | $ | $ | |||||||||
| Netherlands | |||||||||||
| All other countries | |||||||||||
| Total long-lived assets | $ | $ | |||||||||
NOTE 21. RESTRUCTURING
Restructuring charges primarily consist of employee separation benefits under existing severance programs, foreign statutory termination benefits, certain one-time termination benefits, contract termination costs, asset impairment charges and other costs that are associated with restructuring actions. Certain restructuring charges are accrued prior to payments made in accordance with applicable guidance. For such charges, the amounts are determined based on estimates prepared at the time the restructuring actions were approved by management. Inventory write offs due to restructuring are reported in Cost of products and all other restructuring charges are reported as Restructuring expenses in the Statements of Income.
In the third quarter of 2022, the Company implemented a restructuring plan (the “2022/2023 restructuring plan”) to optimize the overall cost structure for the Company on a global basis. The Company completed the 2022/2023 restructuring plan as of March 31, 2024. The total cost in connection with this plan was $17.5 million.
The Company released $0.5 million of the liability related to the 2022/2023 restructuring plan during the year ended December 31, 2025, which it no longer expects to pay due to actual severance payments differing from the original estimates and natural attrition of employees. Restructuring charges related to the 2022/2023 restructuring plan of $1.4 million and $11.4 million were recognized in Restructuring expense within the Consolidated Statements of Income for the years ended December 31, 2024 and 2023, respectively.
In the first quarter of 2025, the Company implemented a restructuring plan (the “JBT Marel 2025 Integration restructuring plan”) aiming to achieve a portion of its synergy targets as a result of the Marel acquisition to optimize the overall cost structure for the combined Company on a global basis. The initiatives under this plan include streamlining operations and adjusting our general and administrative infrastructure to meet the strategic needs of the Company. The total estimated cost in connection with this plan was revised in the third quarter from $25.0 million to $30.0 million to a range of $30.0 million to $35.0 million, and was further updated at year-end to a range of $55.0 million to $60.0 million. These changes are due to additional footprint optimization initiatives. The Company recognized restructuring charges of $31.2 million, net of a cumulative release of the related liability of $0.4 million through December 31, 2025, and expects to recognize the remaining costs by the end of 2026.
The following table details the cumulative restructuring charges reported in operating income for the JBT Marel 2025 Integration restructuring plan since its implementation:
| Cumulative Amount | As of the Quarter Ended | Cumulative Amount | |||||||||||||||||||||||||||||||||
| (In millions) | Balance as of December 31, 2024 | March 31, 2025 | June 30, 2025 | September 30, 2025 | December 31, 2025 | Balance as of December 31, 2025 | |||||||||||||||||||||||||||||
| Severance and related expense | |||||||||||||||||||||||||||||||||||
| Inventory write-off | |||||||||||||||||||||||||||||||||||
| Other | ( | ||||||||||||||||||||||||||||||||||
| Total restructuring charges, net | $ | $ | $ | $ | $ | $ | |||||||||||||||||||||||||||||
105
Restructuring charges related to the JBT Marel 2025 Integration restructuring plan are reported within the following financial statement line items within the Consolidated Statements of Income for the year ended December 31, 2025.
| (In millions) | 2025 | ||||
Cost of sales (1) | |||||
Selling, general and administrative expense (2) | |||||
Restructuring expense (3) | |||||
| Total restructuring related costs | |||||
(1) Restructuring charges reported in Cost of sales are related to inventory write-offs.
(2) Restructuring charges reported in Selling, general and administrative expense are related to property, plant, and equipment impairment charges.
(3) Restructuring charges reported in Restructuring expense primarily include severance and related charges.
Liability balances related to the JBT Marel 2025 Integration restructuring plan are included in Accounts payable, trade and other and Other current liabilities in the accompanying Consolidated Balance Sheets. The table below details the restructuring activities for the year ended December 31, 2025:
| Impact to Earnings | |||||||||||||||||||||||||||||
| (In millions) | Balance as of December 31, 2024 | Charged to Earnings | Releases | Cash Payments | Balance as of December 31, 2025 | ||||||||||||||||||||||||
| Severance and related expense | $ | $ | $ | ( | $ | ( | $ | ||||||||||||||||||||||
| Other | ( | ||||||||||||||||||||||||||||
| Total | $ | $ | $ | ( | $ | ( | $ | ||||||||||||||||||||||
Schedule II—Valuation and Qualifying Accounts
| (In thousands) | Additions | ||||||||||||||||||||||||||||
| Description | Balance at Beginning of Period | Charged to Costs and Expenses | Charged to Other Accounts(a) | Deductions and Other(b) | Balance at End of Period | ||||||||||||||||||||||||
| Year ended December 31, 2023: | |||||||||||||||||||||||||||||
Allowance for credit losses | $ | $ | $ | — | $ | ( | $ | ||||||||||||||||||||||
| Valuation allowance for deferred tax assets | $ | $ | $ | — | $ | ( | $ | ||||||||||||||||||||||
| Year ended December 31, 2024: | |||||||||||||||||||||||||||||
| Allowance for credit losses | $ | $ | $ | — | $ | ( | $ | ||||||||||||||||||||||
| Valuation allowance for deferred tax assets | $ | $ | $ | — | $ | ( | $ | ||||||||||||||||||||||
| Year ended December 31, 2025: | |||||||||||||||||||||||||||||
| Allowance for credit losses | $ | $ | $ | $ | ( | $ | |||||||||||||||||||||||
| Valuation allowance for deferred tax assets | $ | $ | $ | $ | $ | ||||||||||||||||||||||||
(a) “Charged to other accounts” includes balances acquired from Marel.
106
ITEM 9. CHANGES IN AND DISAGREEMENTS WITH ACCOUNTANTS ON ACCOUNTING AND FINANCIAL DISCLOSURE
None.
107
ITEM 9A. CONTROLS AND PROCEDURES
(a)Disclosure Controls and Procedures
As of the end of the period covered by this Annual Report on Form 10-K, management of the Company carried out an evaluation, with the participation of the Chief Executive Officer and the Chief Financial Officer, of the effectiveness of the design and operation of its disclosure controls and procedures (as defined in Rules 13a-15(e) and 15d-15(e) under the Securities Exchange Act of 1934, as amended (the “Exchange Act”)). Based upon that evaluation, the Chief Executive Officer and Chief Financial Officer concluded that disclosure controls and procedures were effective as of December 31, 2025 to ensure that information required to be disclosed in reports the Company files or submits under the Exchange Act is (1) recorded, processed, summarized and reported within the time periods specified in the Commission’s rules and forms, and (2) accumulated and communicated to management, including the Chief Executive Officer and Chief Financial Officer, as appropriate, to allow timely decisions regarding required disclosure.
The Company completed the acquisition of Marel hf. (“Marel”) during 2025 in a purchase business combination. As discussed in Securities and Exchange Commission (“SEC”) staff guidance, a company may conclude it will exclude an acquired business from the assessment of internal control over financial reporting during the first year after completion of an acquisition. In light of the overlap between a company’s disclosure controls and procedures and its internal control over financial reporting, the evaluation of disclosure controls and procedures may also exclude an assessment of the disclosure controls and procedures of the acquired entity that are subsumed in internal control over financial reporting. In consideration of the SEC staff guidance, we excluded Marel, a wholly owned subsidiary, from our assessment of the effectiveness of disclosure controls and procedures as of December 31, 2025. Marel’s total assets and total revenues excluded from our assessment represented approximately 17% and 53% of the Company’s consolidated total assets and consolidated total revenues, respectively, as of and for the year ended December 31, 2025.
(b)Management’s Annual Report on Internal Control over Financial Reporting
Internal control over financial reporting (as defined in Rules 13a-15(f) and 15d-15(f) promulgated under the Exchange Act) is a process designed to provide reasonable assurance regarding the reliability of financial reporting and the preparation of financial statements for external purposes in accordance with generally accepted accounting principles (GAAP) and includes those policies and procedures that:
(i)pertain to the maintenance of records that in reasonable detail accurately and fairly reflect the transactions and dispositions of assets of the Company;
(ii)provide reasonable assurance that transactions are recorded as necessary to permit preparation of financial statements in accordance with GAAP, and that receipts and expenditures of the Company are being made only in accordance with authorizations of management and directors of the Company; and
(iii)provide reasonable assurance regarding prevention or timely detection of unauthorized acquisition, use or disposition of the Company’s assets that could have a material effect on the financial statements.
Because of its inherent limitations, internal control over financial reporting may not prevent or detect misstatements. Also, projections of any evaluation of effectiveness to future periods are subject to the risk that controls may become inadequate because of changes in conditions, or that the degree of compliance with the policies or procedures may deteriorate.
Management is responsible for establishing and maintaining adequate internal control over financial reporting. Under the supervision and with the participation of management, including the Chief Executive Officer and the Chief Financial Officer, management conducted an evaluation of the effectiveness of the Company’s internal control over financial reporting based on criteria established in “Internal Control – Integrated Framework” (2013) issued by the Committee of Sponsoring Organizations of the Treadway Commission (“COSO”). Based on that evaluation, management concluded that the Company’s internal control over financial reporting is effective as of December 31, 2025.
The Company completed the acquisition of Marel during 2025 in a purchase business combination. As discussed in SEC staff guidance, a company may conclude it will exclude an acquired business from the assessment of internal control over financial reporting during the first year after completion of an acquisition. In consideration of the SEC staff guidance, we excluded Marel, a wholly owned subsidiary, from our assessment of the effectiveness of internal control over financial reporting as of December 31, 2025. Marel’s total assets and total revenues excluded from our assessment represented approximately 17% and 53% of the Company’s consolidated total assets and consolidated total revenues, respectively, as of and for the year ended December 31, 2025.
PricewaterhouseCoopers LLP, the Company’s independent registered public accounting firm, has audited the effectiveness of the Company’s internal control over financial reporting as of December 31, 2025, as stated in their report which appears herein.
108
(c) Material Weaknesses Related to Marel
A material weakness is a deficiency, or a combination of deficiencies, in internal control over financial reporting, such that there is a reasonable possibility that a material misstatement of the Company’s annual or interim financial statements will not be prevented or detected on a timely basis.
Prior to the acquisition, Marel management identified the following material weaknesses in its internal control over financial reporting, which remained unremediated as of December 31, 2025:
•Information Technology: The Company’s acquired entity, Marel, did not design and maintain effective information technology general controls for information systems that are relevant to financial reporting. Specifically, Marel did not design and maintain: (i) program change management controls to ensure that information technology program and data changes are identified, tested, authorized, and implemented appropriately; (ii) user access controls to ensure appropriate segregation of duties and to adequately restrict user and privileged access to appropriate personnel; (iii) computer operations controls to ensure that processing and transfer of data, and data backups and recovery are monitored; and (iv) program development controls to ensure that new software development is tested, authorized and implemented appropriately.
These IT deficiencies did not result in a material misstatement to the consolidated financial statements, however, the deficiencies, when aggregated, could impact maintaining effective segregation of duties, as well as the effectiveness of IT-dependent controls (such as automated controls that address the risk of material misstatement to one or more assertions, along with the IT controls and underlying data that support the effectiveness of system-generated data and reports) that could result in misstatements potentially impacting all financial statement accounts and disclosures that would not be prevented or detected.
•Journal entries: The Company’s acquired entity, Marel, did not design and maintain effective controls over the recording and review of journal entries for validity, accuracy, and completeness. Specifically, certain key accounting personnel have the ability to prepare and post journal entries without an appropriately designed independent review. This material weakness did not result in a material misstatement to the consolidated financial statements.
While the above material weaknesses have not resulted in a material misstatement to the consolidated financial statements, such material weaknesses resulted in misstatements that were not material to our consolidated financial statements as of and for the three months ended March 31, 2025. The above material weaknesses could result in additional misstatements of Marel’s financial statement accounts or disclosures, which could result in a material misstatement to the annual or interim consolidated financial statements that would not be prevented or detected.
(d) Remediation Plan
The Company is in the process of completing remediation activities including designing and implementing controls to address the identified material weaknesses, and is working to implement its internal control structure over the acquired operations. The Company continues the process of reviewing the operations of Marel and may identify additional material weaknesses.
(e) Changes in Internal Control over Financial Reporting
In the ordinary course of business, the Company reviews its internal control over financial reporting and makes changes to its systems and processes to improve such controls and increase efficiency, while ensuring that the Company maintains effective internal control over financial reporting. Changes may include such activities as implementing new, more efficient systems, automating manual processes and updating existing systems.
There were no changes in our internal control over financial reporting identified in the evaluation for the quarter ended December 31, 2025 that have materially affected, or are reasonably likely to materially affect, internal control over financial reporting, as defined in Rules 13a-15(f) and 15d-15(f) under the Exchange Act.
109
ITEM 9B. OTHER INFORMATION
Rule 10b5-1 Trading Plans
(b)
On November 21, 2025 , Brian Deck , Chief Executive Officer of the Company, adopted 18,634 shares of the Company's common stock, with the first sale permitted on March 2, 2026. The trading plan is scheduled to terminate on November 16, 2026 , subject to early termination for specified events set forth in the plan.
Other than the trading plan above, no director or officer of the Company adopted or terminated
110
Item 9C. DISCLOSURE REGARDING FOREIGN JURISDICTIONS THAT PREVENT INSPECTIONS
Not Applicable.
111
PART III
ITEM 10. DIRECTORS, EXECUTIVE OFFICERS AND CORPORATE GOVERNANCE
The Company has a code of ethics entitled the “Guide to Ethical Conduct” that applies to employees (including the principal executive officer, principal financial officer and principal accounting officer) as well as directors. A copy of the Guide to Ethical Conduct may be found on the Company’s website at ir.jbtmarel.com under Governance / Governance Documents and is available in print to stockholders without charge by submitting a request to the General Counsel and Secretary of JBT Marel Corporation, 333 West Wacker Drive, Suite 3400, Chicago, Illinois 60606.
The Company also elects to disclose the information required by Form 8-K, Item 5.05, “Amendments to the registrant’s code of ethics, or waiver of a provision of the code of ethics,” through the Company’s website at ir.jbtmarel.com, and such information will remain available on the website for at least a twelve-month period.
Information regarding the Company’s executive officers is presented in the section entitled “Information about our Executive Officers” in Part I of this Annual Report on Form 10-K.
Other information required by this Item will be included in the Proxy Statement for the Company’s 2026 Annual Meeting of Stockholders (the “2026 Proxy Statement”) and is incorporated herein by reference.
112
ITEM 11. EXECUTIVE COMPENSATION
Information required by this item will be included in the 2026 Proxy Statement and is incorporated herein by reference.
113
ITEM 12. SECURITY OWNERSHIP OF CERTAIN BENEFICIAL OWNERS AND MANAGEMENT AND RELATED STOCKHOLDER MATTERS
Information required by this item will be included in the 2026 Proxy Statement and is incorporated herein by reference.
114
ITEM 13. CERTAIN RELATIONSHIPS AND RELATED TRANSACTIONS, AND DIRECTOR INDEPENDENCE
Information required by this item will be included in the 2026 Proxy Statement and is incorporated herein by reference.
115
ITEM 14. PRINCIPAL ACCOUNTANT FEES AND SERVICES
Information required by this item will be included in the 2026 Proxy Statement and is incorporated herein by reference.
* Except for information or data specifically incorporated herein by reference under Items 10 through 14, other information and data appearing in the 2026 Proxy Statement are not deemed to be a part of this Annual Report on Form 10-K or deemed to be filed with the SEC as part of this report.
116
PART IV
ITEM 15. EXHIBITS AND FINANCIAL STATEMENT SCHEDULES
(a)The following documents are filed as part of this Report:
1.Financial Statements: The consolidated financial statements required to be filed in this Annual Report on Form 10-K are listed below and appear on pages 58 through 106 herein:
INDEX TO CONSOLIDATED FINANCIAL STATEMENTS
Report of Independent Registered Public Accounting Firm (PCAOB ID | |||||
Consolidated Statements of Income for the Years Ended December 31, 2025, 2024 and 2023 | |||||
Consolidated Statements of Comprehensive Income for the Years Ended December 31, 2025, 2024 and 2023 | |||||
Consolidated Balance Sheets as of December 31, 2025 and 2024 | |||||
Consolidated Statements of Cash Flows for the Years Ended December 31, 2025, 2024 and 2023 | |||||
2.Financial Statement Schedule: Schedule II—Valuation and Qualifying Accounts is included in this Annual Report on Form 10-K on page 106. All other schedules are omitted because of the absence of conditions under which they are required or because information called for is shown in the consolidated financial statements and notes thereto in Item 8. Financial Statements and Supplementary Data of this Annual Report on Form 10-K.
3.Exhibits:
See Index of Exhibits below for a list of the exhibits being filed or furnished with or incorporated by reference to this Annual Report on Form 10-K.
117
INDEX OF EXHIBITS
| Exhibit Number | Exhibit Description | |||||||
| 2.1 | ||||||||
| 2.2 | ||||||||
| 3.1 | ||||||||
| 3.2 | ||||||||
4.1* | ||||||||
| 4.2 | ||||||||
| 4.3 | ||||||||
| 10.1 | ||||||||
10.1A | ||||||||
10.1B | ||||||||
10.1C | ||||||||
10.1D | ||||||||
10.1E | ||||||||
118
10.2 | ||||||||
10.3 | ||||||||
| 10.4 | ||||||||
| 10.5 | ||||||||
| 10.6 | ||||||||
| 10.7 | ||||||||
10.8 | ||||||||
10.8A | ||||||||
10.8B | ||||||||
10.8C | ||||||||
10.9 | ||||||||
10.9A | ||||||||
10.9B | ||||||||
10.10 | ||||||||
10.11 | ||||||||
10.12 | ||||||||
10.12A | ||||||||
119
120
10.17 | ||||||||
10.17A | ||||||||
10.17B | ||||||||
| 10.18 | ||||||||
10.18A | ||||||||
10.18B | ||||||||
10.18C | ||||||||
| 10.19 | ||||||||
10.19A | ||||||||
10.19B | ||||||||
10.19C | ||||||||
19.1* | ||||||||
| 21.1* | ||||||||
| 23.1* | ||||||||
| 31.1* | ||||||||
| 31.2* | ||||||||
| 32.1* | ||||||||
| 32.2* | ||||||||
121
| 97.1 | ||||||||
| 101.INS* | XBRL Instance Document | |||||||
| 101.SCH* | XBRL Taxonomy Extension Schema Document | |||||||
| 101.CAL* | XBRL Taxonomy Extension Calculation Linkbase Document | |||||||
| 101.DEF* | XBRL Taxonomy Extension Definition Linkbase Document | |||||||
| 101.LAB* | XBRL Taxonomy Extension Label Linkbase Document | |||||||
| 101.PRE* | XBRL Taxonomy Extension Presentation Linkbase Document | |||||||
| 104* | Cover Page Interactive Data File (formatted as Inline XBRL and contained in Exhibit 101). | |||||||
| 1 | The schedules and exhibits to the Amended and Restated Credit Agreement have been omitted from this filing pursuant to Item 601(b)(2) of Regulation S-K. The Company agrees to furnish to the Securities and Exchange Commission, upon request, a copy of any omitted schedule or exhibit; provided, however, that the Company may request confidential treatment pursuant to Rule 24b-2 of the Exchange Act for any schedule or exhibit so furnished. | |||||||
| 2 | A management contract or compensatory plan required to be filed with this report. | |||||||
| * | Filed herewith | |||||||
122
ITEM 16. FORM 10-K SUMMARY
None.
123
SIGNATURES
Pursuant to the requirements of Section 13 or 15(d) of the Securities Exchange Act of 1934, the registrant has duly caused this report to be signed on its behalf by the undersigned, thereunto duly authorized.
JBT Marel Corporation | ||||||||
| (Registrant) | ||||||||
| By: | /s/ Brian A. Deck | |||||||
| Brian A. Deck | ||||||||
Chief Executive Officer | ||||||||
| (Principal Executive Officer) | ||||||||
Date: March 2, 2026
Pursuant to the requirements of the Securities Exchange Act of 1934, this report has been signed below by the following persons on behalf of the registrant and in the capacities and on the date indicated.
| Signature | Title | Date | ||||||||||||
| /s/ BRIAN A. DECK | Director and | March 2, 2026 | ||||||||||||
| Chief Executive Officer | ||||||||||||||
| Brian A. Deck | (Principal Executive Officer) | |||||||||||||
| /s/ MATTHEW J. MEISTER | Executive Vice President and | March 2, 2026 | ||||||||||||
| Chief Financial Officer | ||||||||||||||
Matthew J. Meister | (Principal Financial Officer and Principal Accounting Officer) | |||||||||||||
| /s/ BARBARA BRASIER | Director | March 2, 2026 | ||||||||||||
| Barbara Brasier | ||||||||||||||
| /s/ ALAN D. FELDMAN | Director | March 2, 2026 | ||||||||||||
| Alan D. Feldman | ||||||||||||||
| /s/ POLLY B. KAWALEK | Director | March 2, 2026 | ||||||||||||
| Polly B. Kawalek | ||||||||||||||
| /s/ LAWRENCE V. JACKSON | Director | March 2, 2026 | ||||||||||||
| Lawrence V. Jackson | ||||||||||||||
| /s/ CHARLES L. HARRINGTON | Director | March 2, 2026 | ||||||||||||
| Charles L. Harrington | ||||||||||||||
/s/ SVAFA GRONFELDT | Director | March 2, 2026 | ||||||||||||
Svafa Gronfeldt | ||||||||||||||
124
/s/ OLAFUR S. GUDMUNDSSON | Director | March 2, 2026 | ||||||||||||
Olafur S. Gudmundsson | ||||||||||||||
/s/ ARNAR THOR MASSON | Director | March 2, 2026 | ||||||||||||
Arnar Thor Masson | ||||||||||||||
/s/ ANN SAVAGE | Director | March 2, 2026 | ||||||||||||
Ann Savage | ||||||||||||||
125