JOHN BEAN TECHNOLOGIES CORPORATION PRESENTATION
Published on May 12, 2009
 High-Productivity Solutions Engineered for the Food Processing and Air Transportation Industries Investor Presentation May 2009 Exhibit 99.1 |
 2 These slides and the accompanying presentation contain “forward-looking” statements which represent management’s best judgment as of the date hereof, based on
currently available information. Actual results may differ materially from those contained in such forward-looking statements. The Annual Report on Form 10-K filed by JBT Corporation (the “Company”)
with the Securities and Exchange Commission on March 11, 2009 includes
information concerning factors that may cause actual results to differ from
those anticipated by these forward-looking statements. The Company
undertakes no obligation to update or revise these forward-looking
statements to reflect new events or uncertainties. Although the Company reports its results using GAAP, the Company uses non-GAAP measures when management believes those measures provide useful information for its
stockholders. The appendices to this presentation provide
reconciliations to GAAP for any non-GAAP measures referenced in this
presentation. Forward-Looking Statements |
 3 • Investment Highlights • Segment Overview • Business Fundamentals & Core Strategies Agenda |
 Investment Highlights |
 5 Investment Highlights • Long, rich history in markets we helped develop • Technology and market leader with blue chip customer base • Global footprint with extensive capabilities • Track record of profitable growth and stable cash flow • Large installed base drives growth in recurring revenue • Experienced and diverse leadership team |
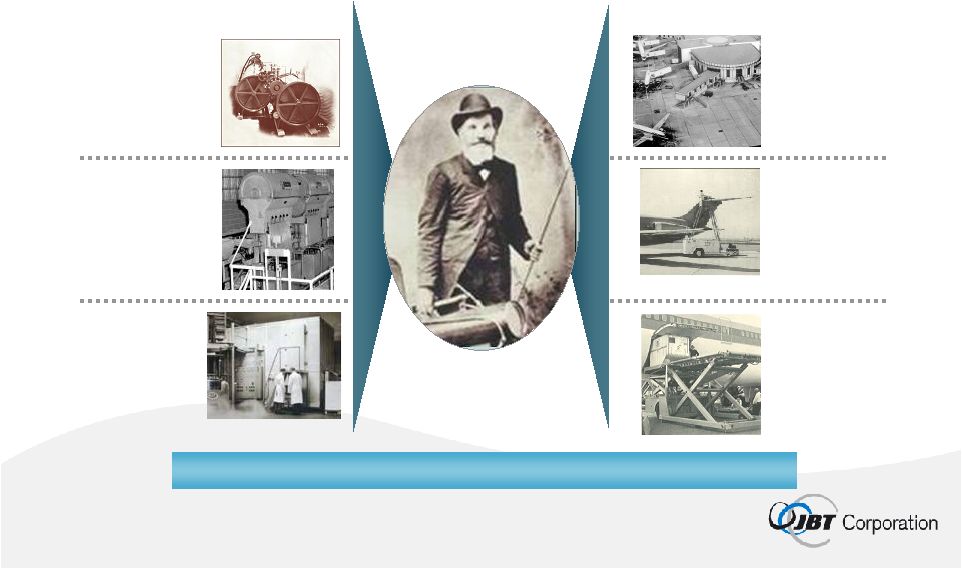  6 Long, Rich History in Markets We Helped Develop 1962 Introduced the Deicer 1969 Introduced the first Cargo Loader for the Boeing 747 1959 Introduced the first Jetway passenger boarding bridge 1920 Introduced the Cooker Cooler 1950 Introduced the first In-line Juice Extractor 1960 Introduced the first FLoFREEZE Freezer Air Transportation Food Processing Our history of innovation began with John Bean |
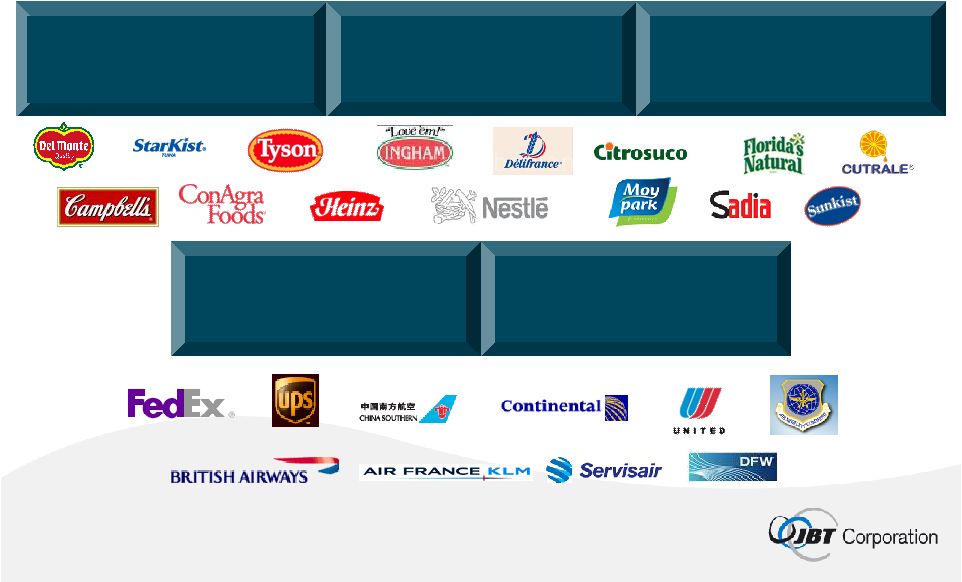 7 sterilize more than 50% of the world’s shelf stable canned foods squeeze more than 75% of the world’s citrus juices freeze more than 50% of the world’s frozen foods load 70% of the world’s overnight express packages board 75% of U.S. passengers Market Leader with Blue Chip Customer Base Our Systems: |
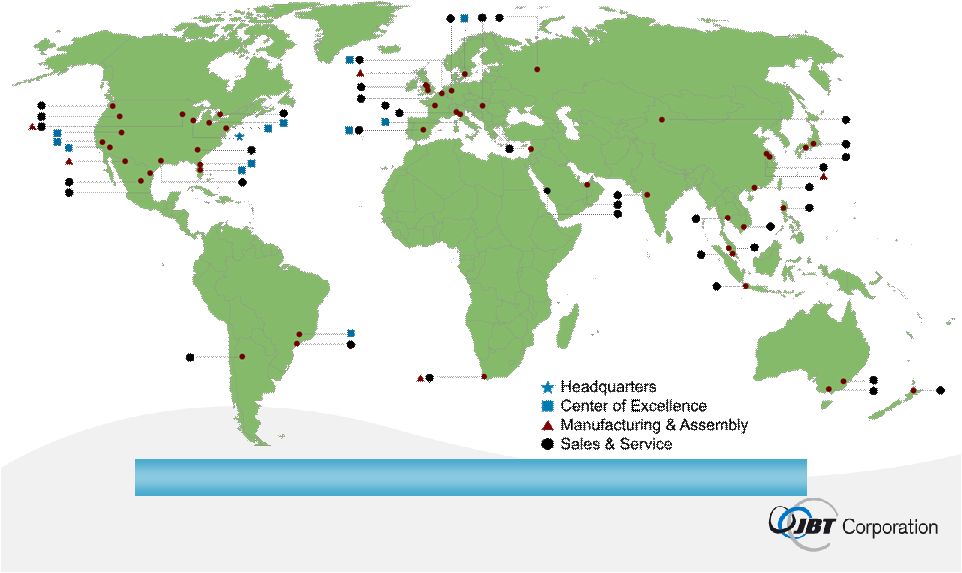 8 Global Footprint with Extensive Capabilities More than 50% of revenue derived from outside the United States
|
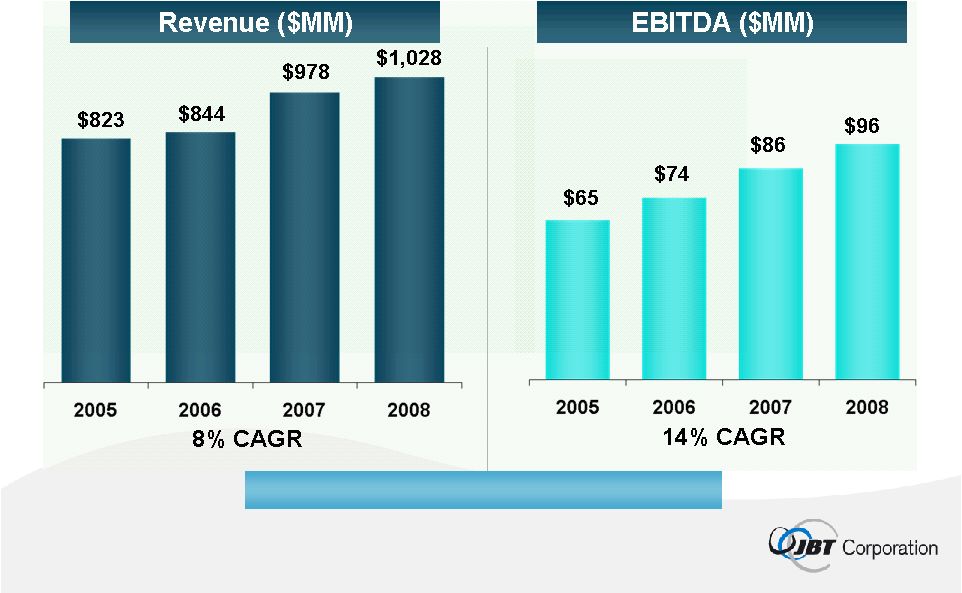 9 Track Record of Profitable Growth Note: See Appendix I for reconciliation of EBITDA to Net Income Double-digit EBITDA Growth |
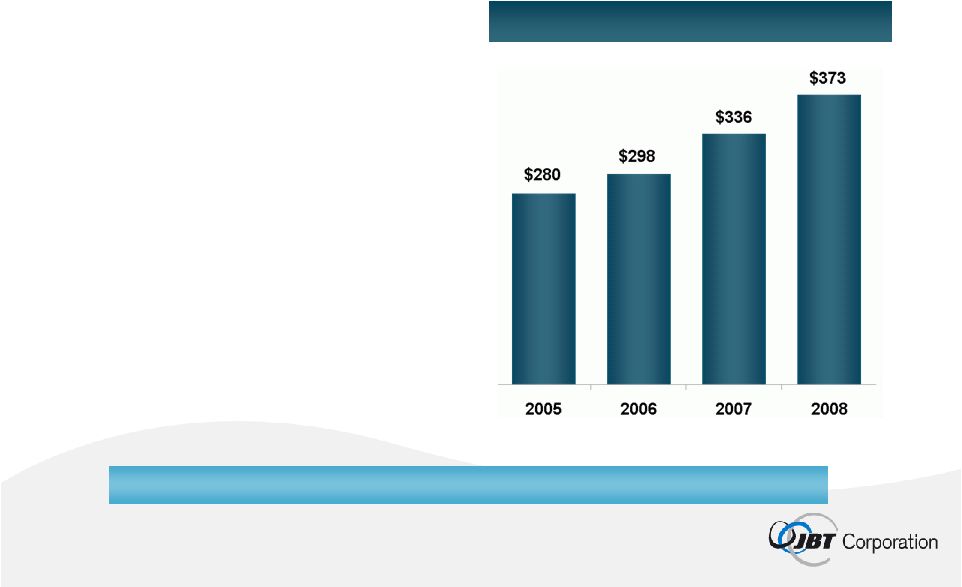 10 Delivered Base (units) • FoodTech: 40,000+ • AeroTech: 30,000+ Large Base of Recurring Revenue Recurring Revenue ($MM) 10% CAGR Note: Recurring revenue includes aftermarket parts and services, equipment leases, and airport services Recurring revenue was 36% of 2008 total revenue |
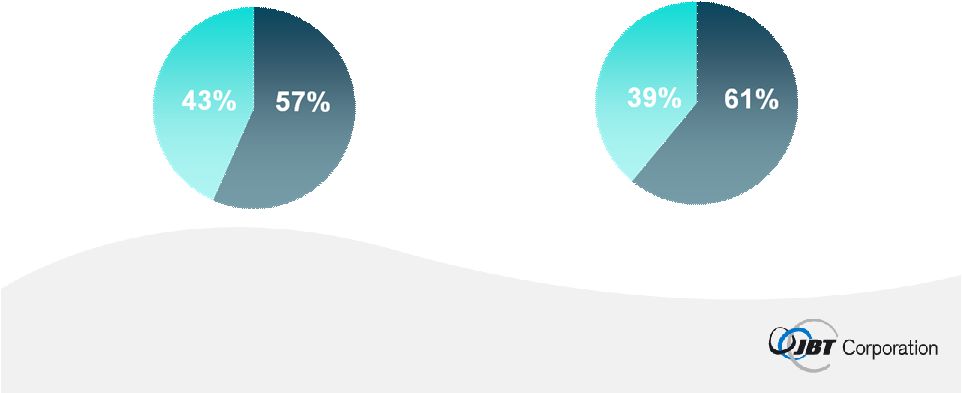 11 Total Revenue FoodTech AeroTech 2008 Revenue & Operating Profit by Segment Total Segment Operating Profit AeroTech FoodTech |
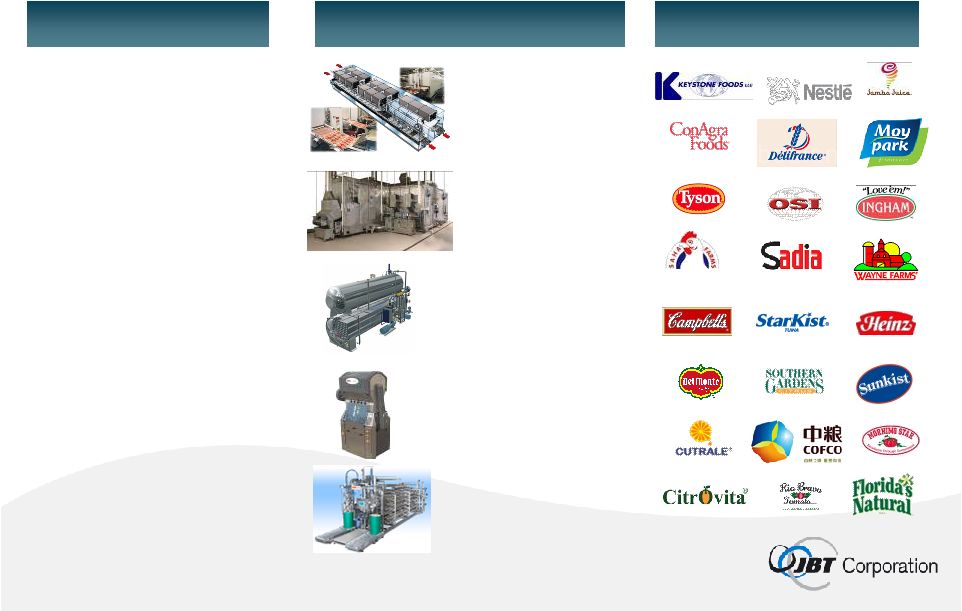 12 Note: % of 2008 revenue excludes aftermarket parts and service Tomato Paste Tomato Sauces Juices Beverages Fruit Processing 32% of revenue Shelf-Stable Products Formulated Milks Beverages In-Container Processing 14% of revenue Poultry & Meat Seafood Protein Processing 18% of revenue Poultry & Meat Seafood Fruit & Vegetables Baking Products Freezing & Chilling 36% of revenue Technologies Applications Customers FoodTech: #1 or #2 in Core Product Offerings |
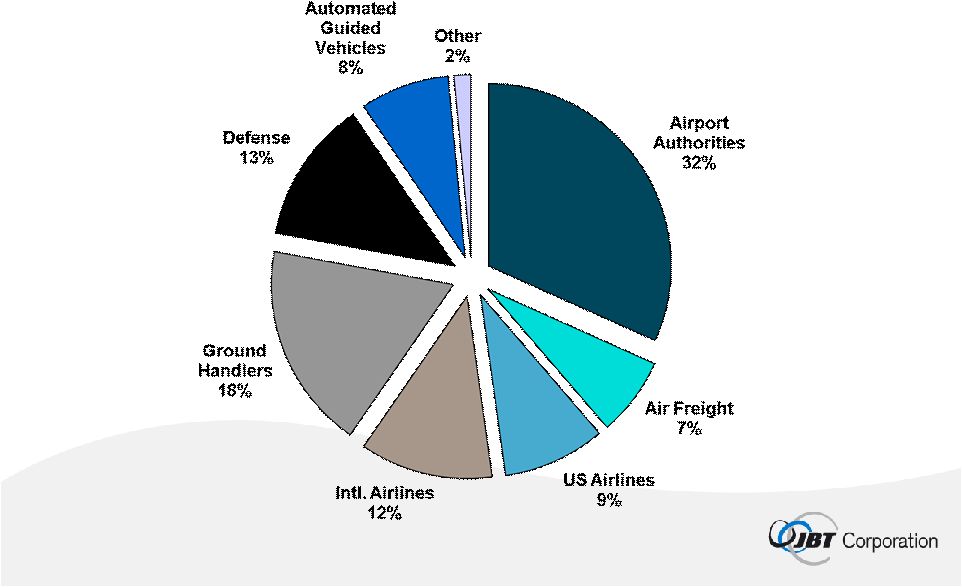
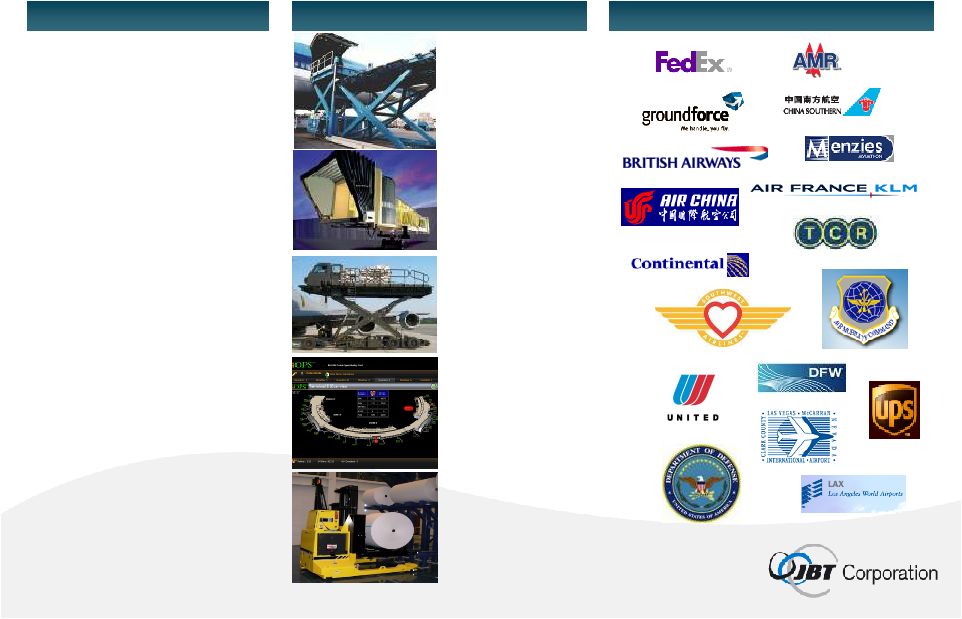 13 Ground Support 43% of revenue Maintaining and monitoring facilities and equipment Passenger boarding Air and power supply Gate Equipment 28% of revenue Container and palletized cargo loading Military Equipment 5% of revenue Container loading Cargo transporting Baggage loading Pushback/Towing Aircraft Deicing Airport Services 16% of revenue Technologies Applications Customers AeroTech: #1 or #2 in Core Product Offerings Automated Systems 8% of revenue Automated Guided Vehicle Systems for material handling Note: % of 2008 revenue excludes aftermarket parts and services for AeroTech’s
equipment |
 Business Fundamentals & Core Strategies |
 15 • Strong balance sheet and liquidity positions • Large base of recurring revenue & cash flow • Broad product, customer, and geographic diversity • Low capital requirements & efficient working capital utilization • Variable cost structure Solid Fundamentals in the Midst of Uncertainty |
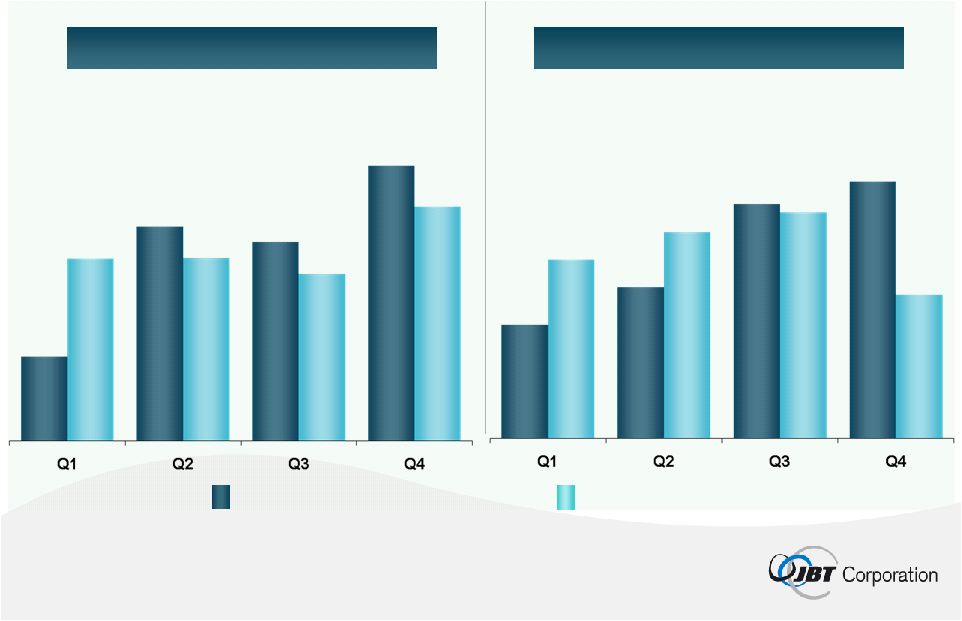 16 FoodTech AeroTech Business Seasonality % of Annual Segment EBIT Historical Avg. ’05-07 2008 Actual |
 17 • Extend technology leadership • Leverage installed base • Capture international opportunities • Bolt-On Acquisitions Core Strategies |
 High-Productivity Solutions Engineered for the Food Processing and Air Transportation Industries |
 Backup |
 Segment Information |
 21 JBT FoodTech Field of View Bakery Meat, Poultry & Seafood Fruit & Vegetable Ready Meals Dairy Pet Food Non-Carb Bev Aftermarket Products and Services Freezing and Chilling In-Container Processing Filling, Closing & Sterilization Freezing Raw Ingredient Preparation Thermal Processing Non-thermal Processing End of Line Packaging / Palletizing Food Segments Carb Bev Aftermarket Primary Processing Confect Process Steps |
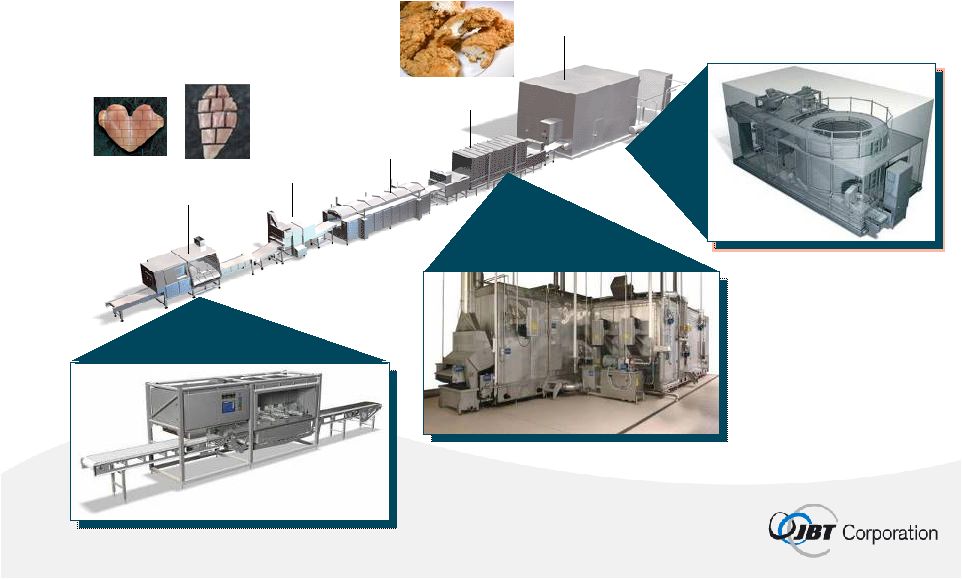 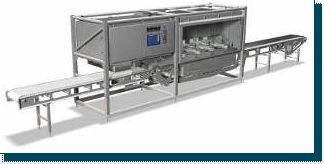  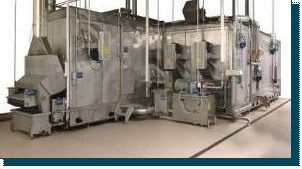   22 Higher Performance Through Continuous Innovation Coater 3D Portioner Fryer Oven Freezer DSI Accura™ Portioning System GYRoCOMPACT-II Oven GYRoCOMPACT M-Series Spiral Freezer |
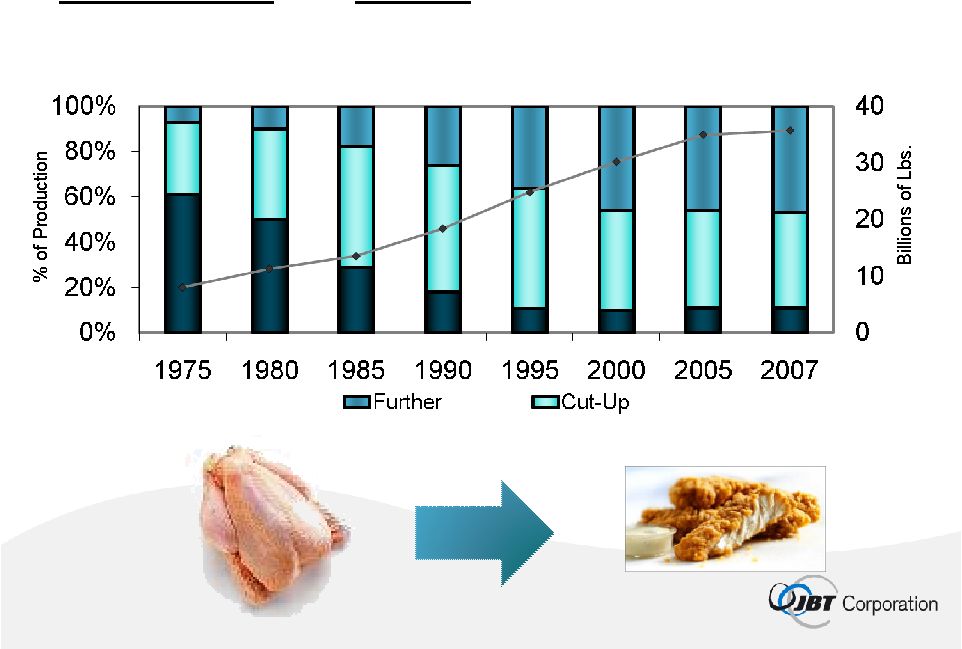 23 Convenience and Choice Drive Demand in Developed Markets U.S. Poultry Production Source: National Chicken Council Broiler Production = 4.8% CAGR Further Process = 6.1% CAGR |
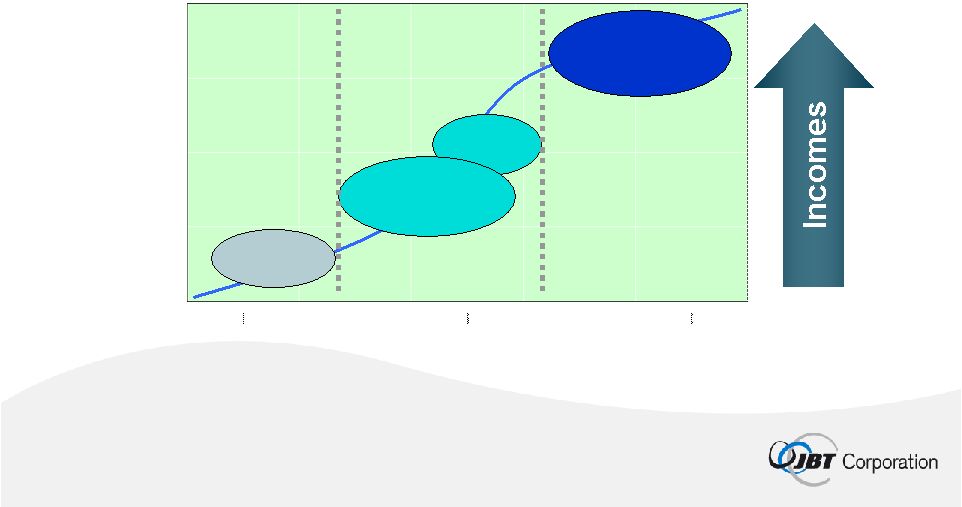          24 Source: Rabobank Developing Markets Provide a Significant Growth Opportunity for Processed Food Technology Diet Profile Survival Staples Variety Convenience High-tech Grain Roots Meat, Dairy Fruit &Veg. Prepared Foods Functional Foods Diet Component Sub-Saharan Africa Eastern Europe L. America China India Developing Markets Developed Markets W. Europe Japan USA |
 We
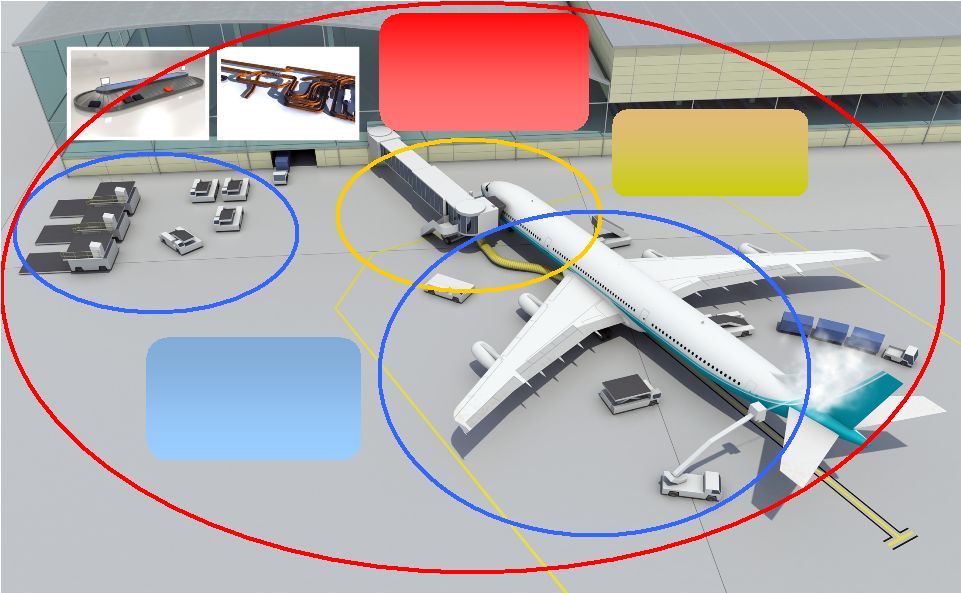
Address Multiple Needs Across the Ground Support Spectrum Ground Support Equipment Cargo Loaders & Transporters Deicers Aircraft Tractors Passenger Stairs Maintenance & Operation Gate Systems Baggage Handling Systems Ground Support Equipment Airport Facilities Technology Aircraft Support Systems Passenger Boarding Bridges 400Hz
Converters
Pre-conditioned Air
|
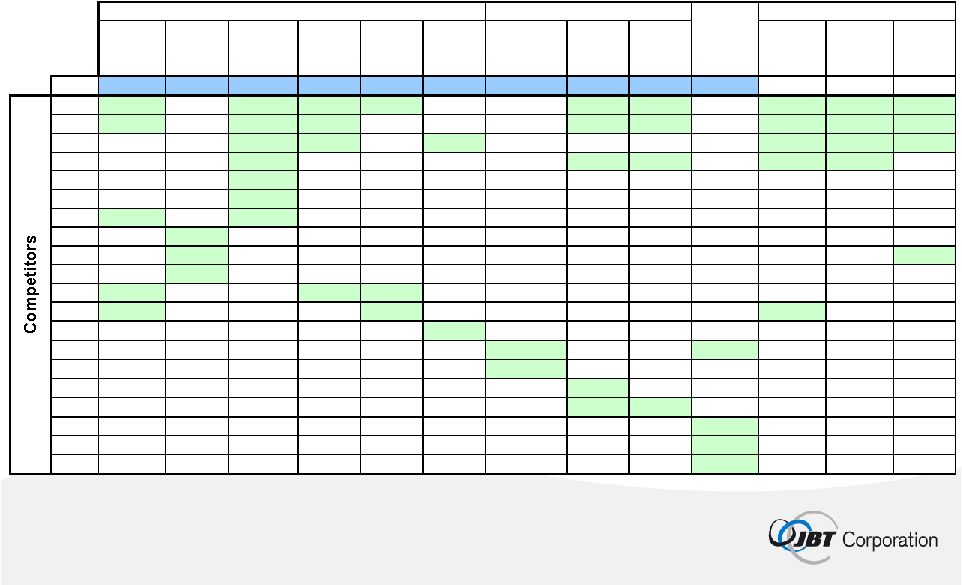 26 JBT AeroTech – Market Positions Loaders Deicers Tow Tractors Pax Steps Trans- porters Bulk Load Sys Passenger Boarding Bridges 400Hz Power PC Air Luggage Tractors Belt Loaders Lav Service JBT • • • • • • • • • • A • • • • • • • • • B • • • • • • • • C • • • • • • D • • • • • E • F • G • • H • I • • J • K • • • L • • • M • N • • O • P • Q • • R • S • T • Other Equipment Ground Support Equipment Gate Equipment Airport Services |
 27 JBT AeroTech – Customers 2008 Sales of new equipment & technical services |
       28 World Economy Passenger Traffic Cargo Traffic Source: The Boeing Company, 2006 Market Outlook, Summary Outlook 2008-2027 Long-term, Passenger and Cargo Traffic Expected to Grow Faster Than Global Economy 2.9% 4.8% 6.3% Actual Market Growth Rates: 1985 to 2005 4.0% 5.8% Forecast Market Growth Rates: 2007 to 2027 3.2% |
 Financial Highlights |
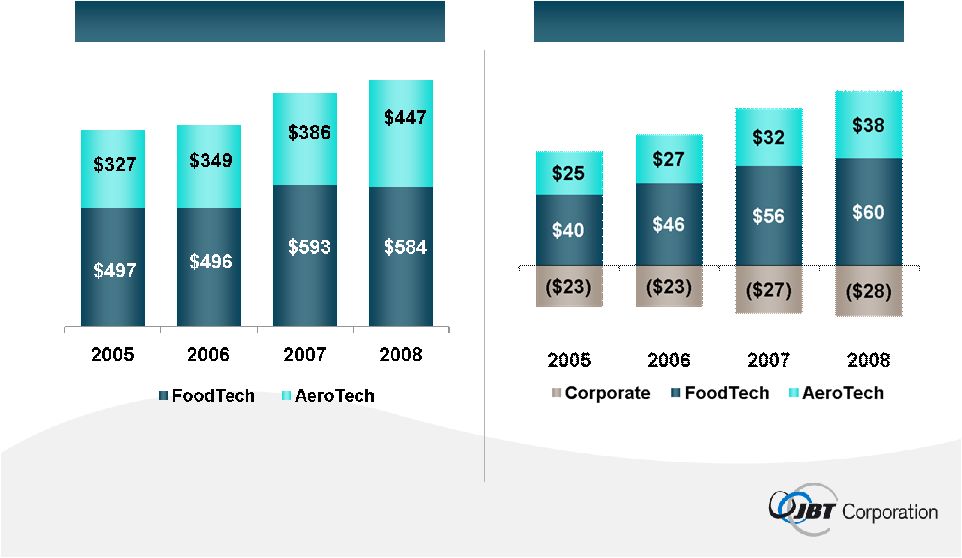 30 Track Record of Profitable Growth Revenue ($MM) EBIT ($MM) Notes: 1) Total revenue will not foot due to other revenue and intercompany eliminations
2) Reconciliation of EBIT (a non-GAAP measure) to Net Income is included
in Appendix I $823 $844 $978 $1,028 $42 $50 $61 $70 |
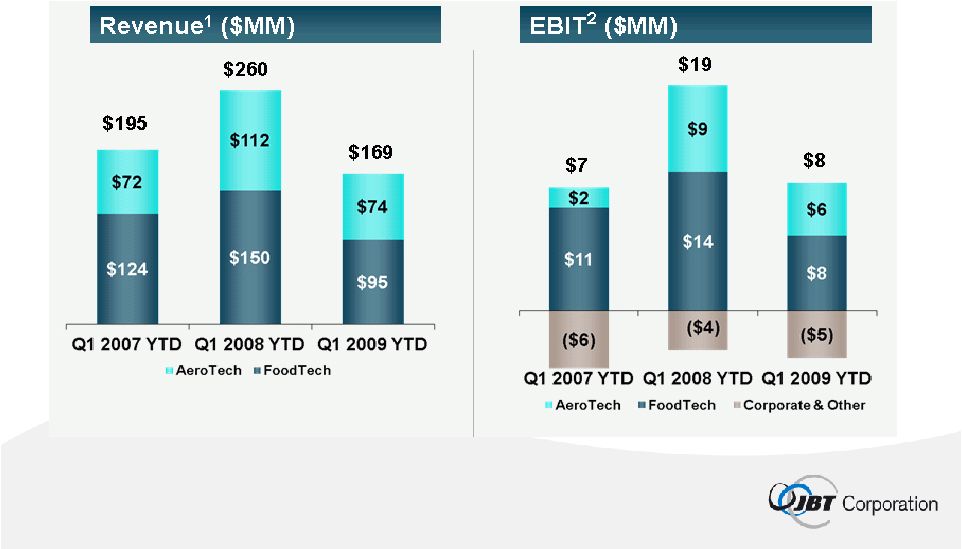 31 1. Excludes intercompany eliminations 2. See Appendix II for reconciliation of EBIT to Net Income Solid Performance in First Quarter 2009 |
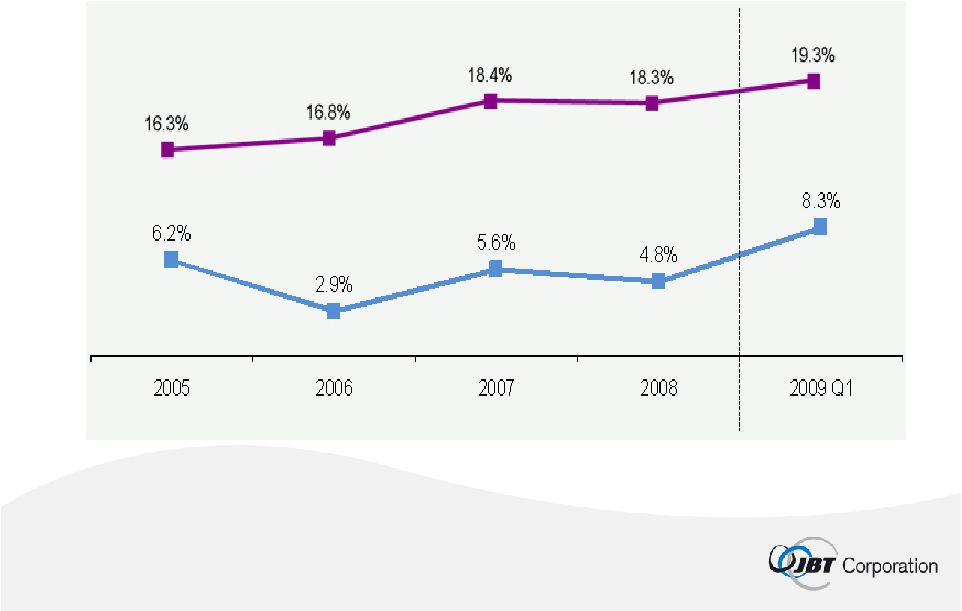 32 Notes: 1) Adjusted working capital is calculated as current assets (excluding cash and
short term investments) less current liabilities (excluding current portion
of debt) 2) A Reconciliation to the GAAP measure for working capital is
provided in Appendix III 3) The companies included in the
selected industrials sample is provided in Appendix V Efficient Working Capital
Management (% of Revenue) JBT Selected Industrials Mean |
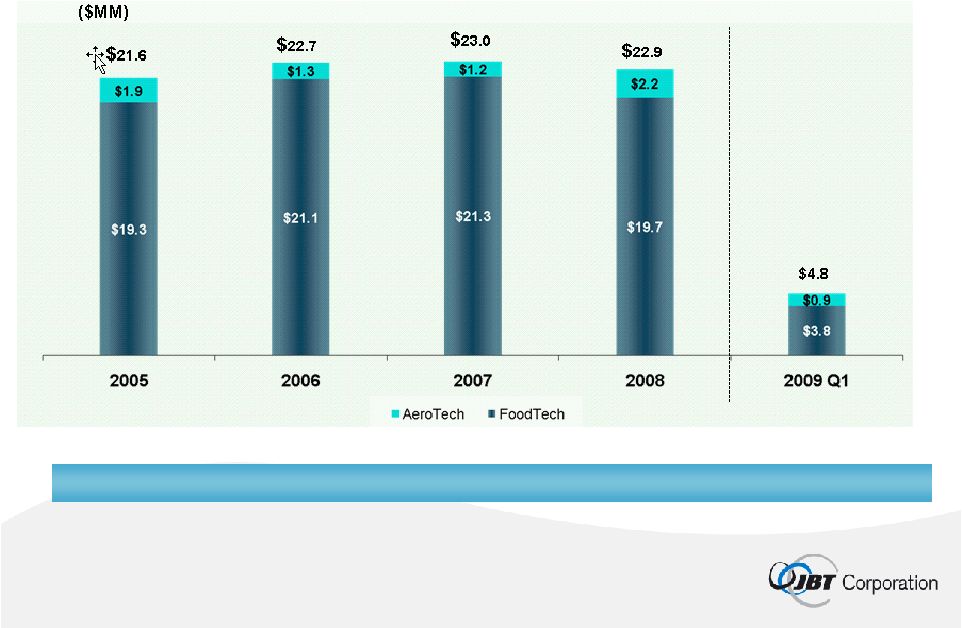 33 Capital Expenditures Note: Total capital expenditures include corporate but not shown Capital expenditures have historically averaged ~2% of revenues
|
 34 Strong Free Cash Flow Generation $MM 2005 2006 2007 2008 2009 Q1 Net Income from Continuing Operations $26.4 $34.8 $40.1 $44.1 $4.1 + Depreciation & Amortization 22.2 23.2 25.1 25.5 5.1 - Capital Expenditures (21.6) (22.7) (23.0) (22.9) (4.8) - Acquisitions - - - (4.5) - +/- Change in Operating Assets & Liabilities (1.3) 28.6 (42.3) (6.9) 9.9 +/- Other 13.7 12.8 19.2 20.5 (12.5) +/- Discontinued Operations 5.5 (0.7) 2.5 0.7 (0.1) Adjusted Free Cash Flow $44.9 $76.0 $21.6 $56.5 $1.7 Notes: 1) ‘Other’ contains stock based compensation, disposal of assets, purchase of treasury stock, and other changes in balance sheet accounts 2) A reconciliation of Adjusted Free Cash Flow (a non-GAAP measure) to cash
provided by operations, is included in Appendix IV
|
 35 Note: Return on Investment (ROI) is calculated as net income from continuing
operations plus after-tax interest expense as a percentage of average
owner’s net equity and long term debt. Attractive Return on Investment |
 36 Debt Structure Private Placement Credit Facility Amount Maturity Pricing Security Covenants • $225 MM • $90 MM drawn as of Q1 2009 • LIBOR +125 bps • $50MM swapped to 4.9% fixed rate • Max. Total Debt / EBITDA of 3.0x • Min. EBITDA / Interest Expense of 3.5x • July 31, 2013 • Unsecured • $75 MM • $75 MM drawn as of Q1 2009 • 6.7% • July 31, 2015 • Unsecured • Max. Total Debt / EBITDA of 3.25x • Min. EBITDA / Interest Expense of 2.75x |
 Appendix |
 38 Appendix I Reconciliation of Non-GAAP measures (as required by Regulation G) (In millions) FY 2005 FY 2006 FY 2007 FY 2008 2009 Q1 Net income (GAAP measure) $24.5 $34.6 $36.4 $44.2 $4.1 add-back: loss from discontinued operations, net of taxes 1.9 0.2 3.7 (0.1) 0.0 add-back: provision for income taxes on operating income 16.0 16.0 21.5 22.4 2.1 less: interest income, net (0.1) (0.4) (0.5) 3.8 2.2 EBIT (non-GAAP measure) $42.3 $50.4 $61.1 $70.3 $8.4 add-back: depreciation expense 17.5 18.8 19.8 20.5 4.3 add-back: amortization expense 4.7 4.4 5.3 5.0 0.8 EBITDA (non-GAAP measure) $64.5 $73.6 $86.2 $95.8 $13.5 |
 39 Appendix II Reconciliation of Non-GAAP measures (as required by Regulation G) (In millions) 2007 Q1 2008 Q1 2009 Q1 Net income (GAAP measure) $3.2 $12.3 $4.1 less: income from discontinued operations, net of taxes 0.8 (0.3) 0.0 add-back: provision for income taxes on operating income 2.9 7.4 2.1 less: interest income, net (0.1) (0.1) 2.2 Adjusted EBIT (non-GAAP measure) $6.8 $19.3 $8.4 |
 40 Appendix III Reconciliation of Non-GAAP measures (as required by Regulation G) (In millions) FY 2005 FY 2006 FY 2007 FY 2008 2009 Q1 Current assets $293.9 $313.4 $369.8 $357.0 $327.8 Current liabilities 240.4 279.2 306.2 264.4 249.7 Working capital (GAAP measure) $53.5 $34.2 $63.6 $92.6 $78.1 less: cash and cash equivalents (2.7) (10.3) (9.5) (43.6) (22.4) less: short-term investments 0.0 0.0 0.0 0.0 0.0 plus: short-term debt and current portion 0.1 0.2 1.1 0.6 0.5 of long-term debt Adjusted working capital (non-GAAP measure) $50.9 $24.1 $55.2 $49.6 $56.2 Revenue $823.3 $844.3 $978.0 $1,028.1 $676.0 Adjusted working capital as a percentage of revenue 6.2% 2.9% 5.6% 4.8% 8.3% |
 41 Appendix IV Reconciliation of Non-GAAP measures (as required by Regulation G) (In millions) FY 2005 FY 2006 FY 2007 FY 2008 Q1 2009 Cash provided by operating
activities (GAAP measure) $59.6 $96.0 $33.7 $81.8 $6.0 less: capital expenditures (21.6) (22.7) (23.0) (27.4) (4.8) Free cash flow $38.0 $73.3 $10.7 $54.4 $1.2 plus: net cash provided (required) by investing (0.1) (0.4) 7.8 0.7 0.0 activities of discontinued operations plus: proceeds from disposal of assets 7.0 3.1 3.1 2.1 0.5 plus: other cash provided (required) by investing 0.0 0.0 0.0 0.0 0.0 activities less: purchase of stock held in treasury 0.0 0.0 0.0 (0.7) 0.0 Adjusted free cash flow (non-GAAP measure) $44.9 $76.0 $21.6 $56.5 $1.7 |
 42 Appendix V Listing of Selected Industrials * Baldor Electric Co. and NACCO Industries data is through 2008 1. AAR Corporation 2. Baldor Electric Company* 3. Briggs & Stratton 4. Enpro Industries Inc. 5. Federal Signal Corporation 6. Gardner Denver Inc. 7. NACCO Industries* 8. Oshkosh Corporation 9. Regal-Beloit Corporation 10. A.O. Smith Corporation 11. Tennant Company |