JOHN BEAN TECHNOLOGIES CORPORATION PRESENTATION
Published on July 17, 2008
 1 High-Productivity Solutions Engineered for Food Processing and Air Transportation Investor Presentation July 2008 Exhibit 99.1 |
 2 These slides and the accompanying presentation contain “forward-looking” statements which represent management’s best judgment as of the date hereof, based on
currently available information. Actual results may differ materially from those contained in such forward-looking statements. JBT Corporation’s (the “Company”) Form 10 Registration Statement filed
under the Securities Exchange Act of 1934 includes information concerning
factors that may cause actual results to differ from those anticipated by
these forward-looking statements. The Company undertakes no obligation
to update or revise these forward- looking statements to reflect new
events or uncertainties. Although the Company reports its results using GAAP, the Company uses non-GAAP measures when management believes those measures provide useful information for its
stockholders. Forward-Looking Statements |
 3 • Transaction Overview • Investment Highlights - JBT Corporation Overview - JBT FoodTech Overview - JBT AeroTech Overview • Strategies for Growth • Financial Overview • Charles H. Cannon, Jr. - Chairman of the Board, Chief Executive Officer • Ronald D. Mambu - Vice President, Chief Financial Officer Agenda Speakers Today’s Speakers and Agenda |
 Transaction Overview |
 5 Description Tax-free distribution to FMC Technologies (FTI) shareholders Listing NYSE: JBT Distribution Ratio 1 FTI share : 0.216 JBT shares Estimated JBT Shares 27.6 million Dividend per Share $0.07 per quarter When Issued Trading July 18, 2008 Record Date July 22, 2008 Distribution Date July 31, 2008 Regular Way Trading August 1, 2008 Transaction Overview |
 Investment Highlights |
 7 Investment Highlights • Experienced and diverse leadership team • Long, rich history in markets we helped develop • Technology and market leader with blue chip customer base • Global footprint with extensive capabilities • Track record of profitable growth • Large installed base drives growth in recurring revenue • Well-positioned to capture growth opportunities • Growing profits and stable cash flows support debt paydown, dividend and reinvestment |
 8 Charles H. Cannon, Jr. Chairman of the Board, 26 Chief Executive Officer Ronald D. Mambu Vice President, Chief Financial Officer 34 Torbjörn Arvidsson Vice President and Division Manager, 21 Food Solutions and Services Juan C. Podesta Vice President and Division Manager, 19 Food Processing Systems To Be Announced Vice President and Division Manager, -- JBT AeroTech Years with Company Operating Management Team • 20+ years average FMC tenure • Multi-cultural team: 9 nationalities and 9 languages • Majority have worked and lived abroad Senior Management Team Experienced and Diverse Leadership Team |
 9 Charles H. Cannon, Jr. Served in various positions within FMC Corporation and FMC Technologies since 1982 including Senior Vice President of FMC Technologies and General Manager of FMC FoodTech and Airport
Systems; currently a Board Member of Standex International Corporation and the Food Machinery Europe Association C. Maury Devine Served in various positions within ExxonMobil Corporation since 1994 including
President and Managing Director of ExxonMobil Norway and Secretary of Mobil
Corporation; previously held positions within the U.S. Government; currently a Board Member of FMC Technologies and Det Norske Veritas Alan D. Feldman Has served as the Chairman, President and CEO of Midas, Inc. since 2003; previously
held senior management positions within McDonald’s and PepsiCo; currently a Board Member of Footlocker, Inc. James E. Goodwin Served as Chairman and CEO of UAL and United Airlines from 1999 to 2001; currently a Board Member of AAR Corporation, Federal Signal Corporation and First Chicago Bank &
Trust Polly B. Kawalek Served as President of PepsiCo’s Quaker Foods division from 2002 to 2004;
previously held various positions for 25 years within Quaker Oats; currently a Board Member of Martek Biosciences Corp. and Kimball International, Inc. James M. Ringler Has served as Chairman of Teradata Corporation since 2007; previously held senior
management positions with Illinois Tool Works, Premark International Inc.,
White Consolidated Industries and The Tappan Company; currently a Board Member of FMC Technologies, Dow Chemical Company, Corn Products International, Inc. and Autoliv Inc. James R. Thompson Has served in various positions with Winston & Strawn LLP since 1991 including
Senior Chairman and Chairman; previously held various positions with the U.S. Government including the Governor of Illinois from 1977 to 1991; currently a Board Member of FMC Technologies, Navigant Consulting Group, Inc.
and Maximus, Inc. Experience Board of Directors Highly Experienced Board of Directors |
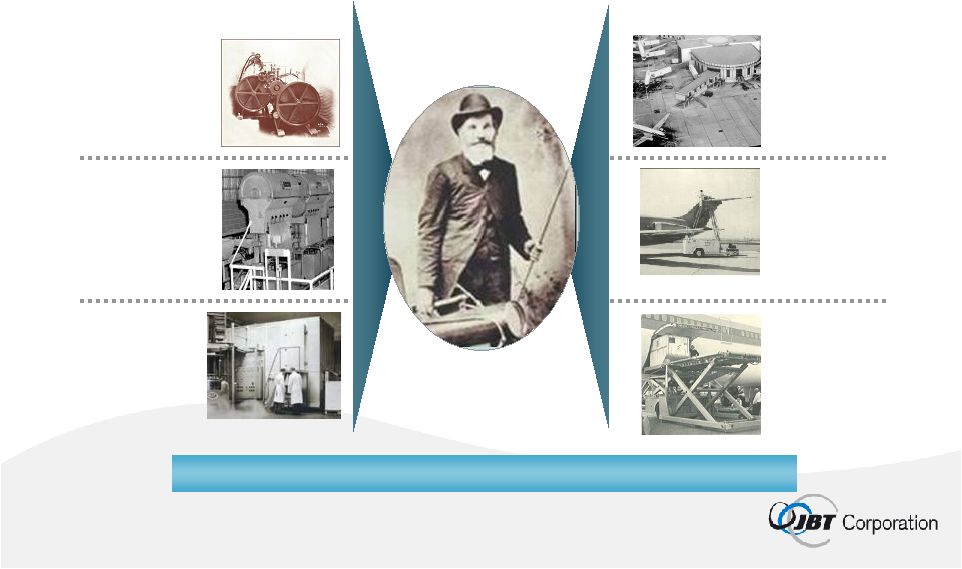  10 Long, Rich History in Markets We Helped Develop 1962 Introduced the Deicer 1969 Introduced the first Cargo Loader for the Boeing 747 1959 Introduced the first Jetway passenger boarding bridge 1920 Introduced the Cooker Cooler 1950 Introduced the first In-line Juice Extractor 1960 Introduced the first FLoFREEZE Freezer Air Transportation Food Processing Our history of innovation began with John Bean |
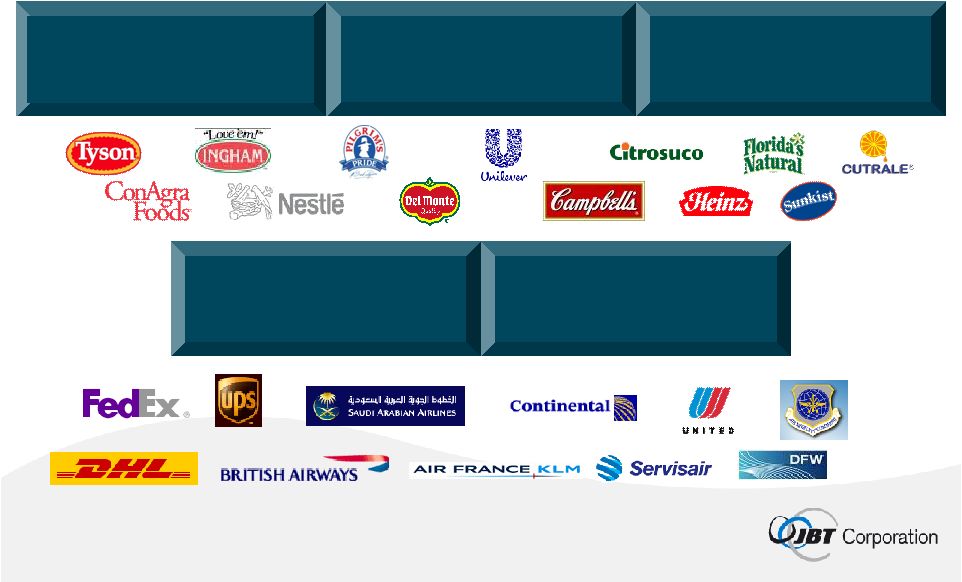 11 sterilize more than 50% of the world’s shelf stable canned foods squeeze more than 75% of the world’s citrus juices freeze more than 50% of the world’s frozen foods load 70% of the world’s overnight express packages board 75% of U.S. passengers Market Leader with Blue Chip Customer Base Our Systems: |
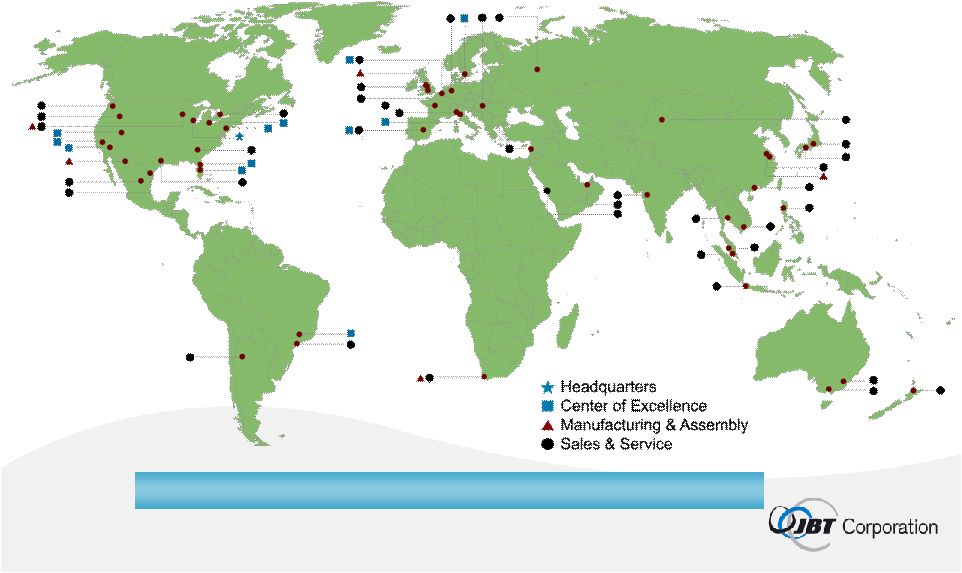 12 Global Footprint with Extensive Capabilities ~50% of revenue derived from outside the United States |
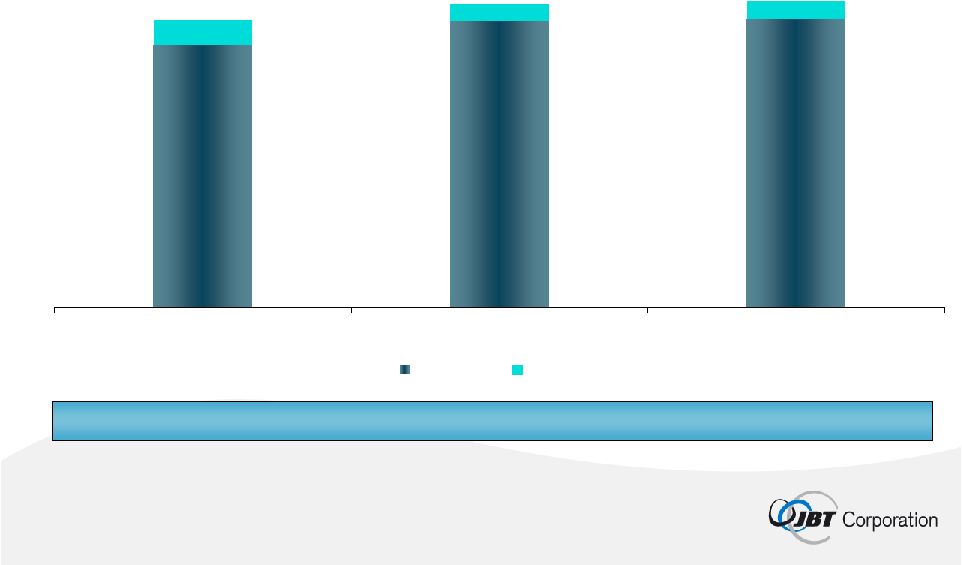
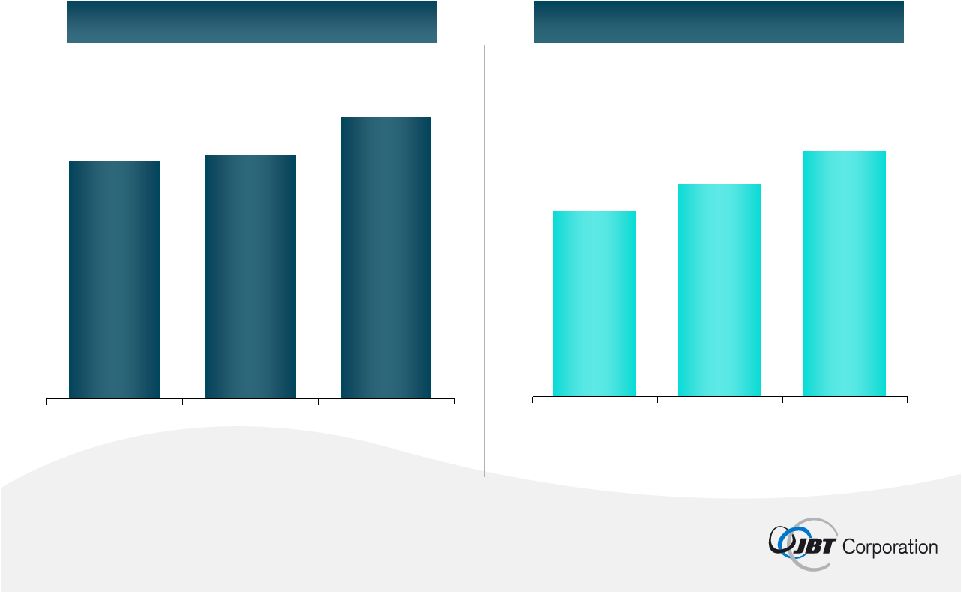 13 2005 2006 2007 2005 2006 2007 Revenue ($MM) EBITDA ($MM) $823 $844 $978 Track Record of Profitable Growth $65 $74 $86 9% CAGR 15% CAGR Note: See Appendix I for reconciliation of EBITDA to Net Income
|
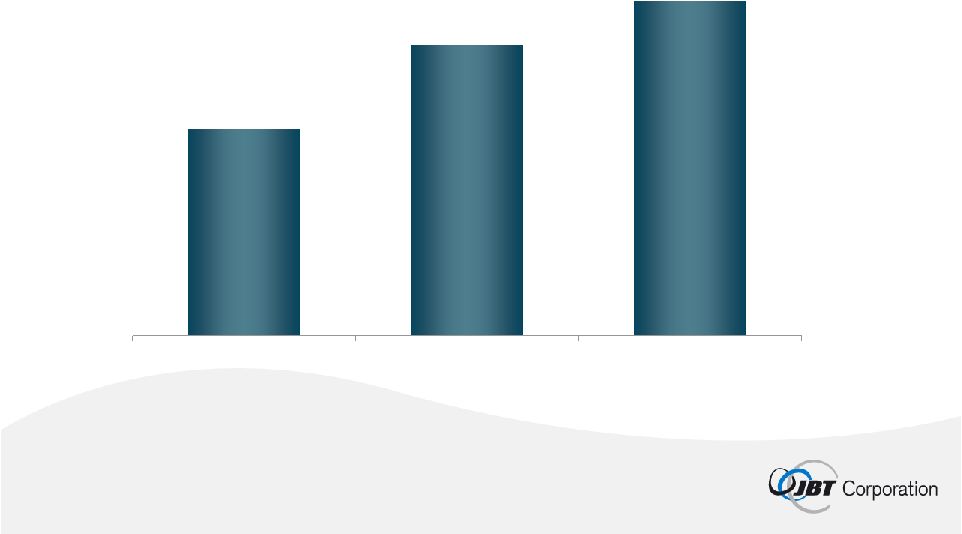
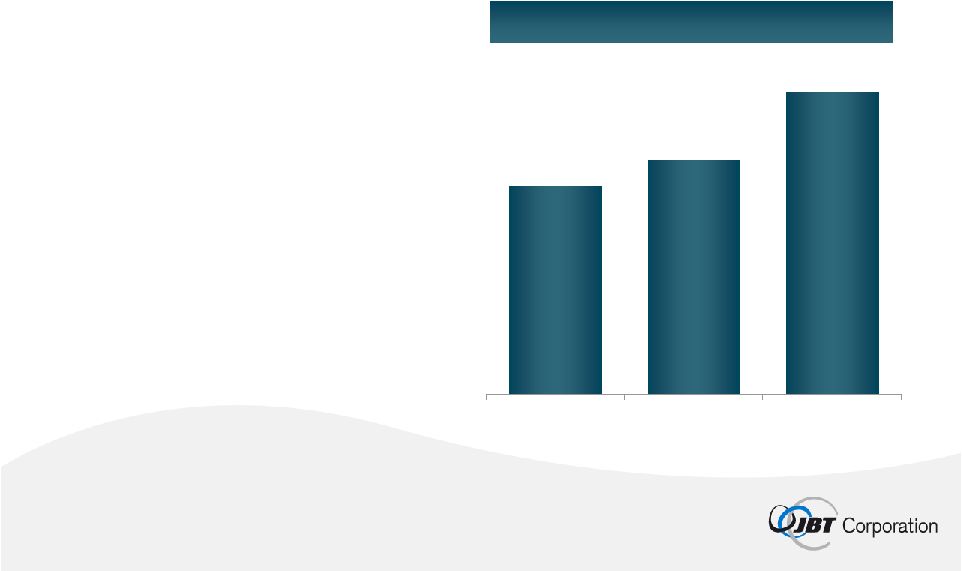 14 $201 $178 $170 2005 2006 2007 Delivered Base (units) • FoodTech: 40,000+ • AeroTech: 30,000+ Large Installed Base Drives Growth in Recurring Revenue Aftermarket Revenue ($MM) 9% CAGR |
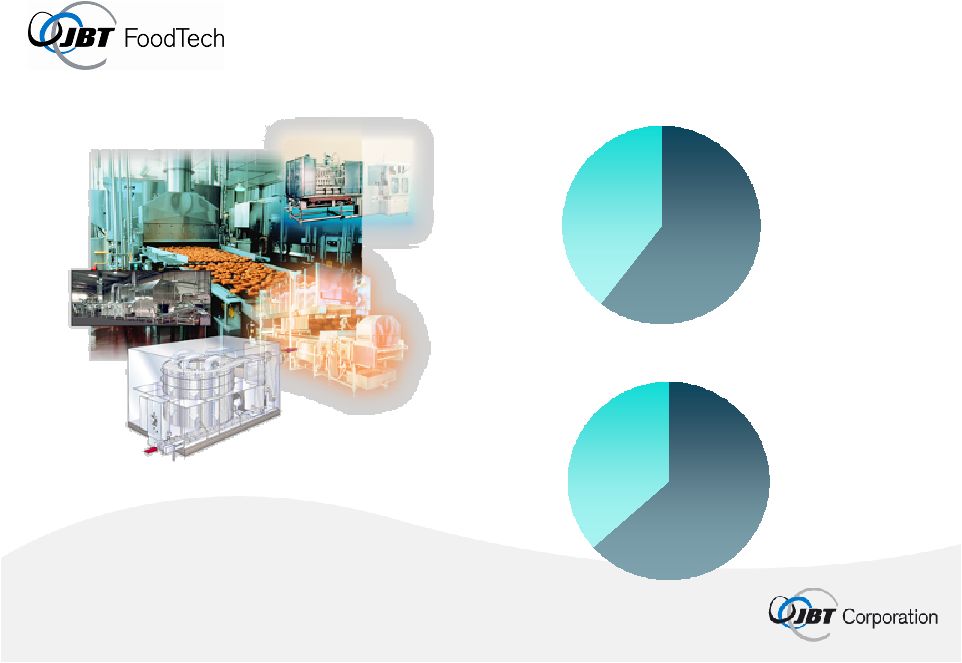 15 63% 61% FY07 Total Revenue FoodTech¹ FoodTech FY07 Total Segment Operating Profit $593MM $56MM 1. Excludes intercompany eliminations We Are With You, Right Down The Line™ |
 16 Note: % of revenue exclude aftermarket parts and services Tomato Paste Tomato Sauces Juices Beverages Fruit Processing 32% of revenue Shelf-Stable Products Formulated Milks Beverages Shelf Stable Sterilization 15% of revenue Poultry & Meat Seafood Protein Processing 17% of revenue Poultry & Meat Seafood Fruit & Vegetables Baking Products Freezing & Chilling 36% of revenue Technologies Applications Customers #1 or #2 in Core Product Offerings |
    17 Cost per Unit Throughput and Yield We Are With You, Right Down The Line™ |
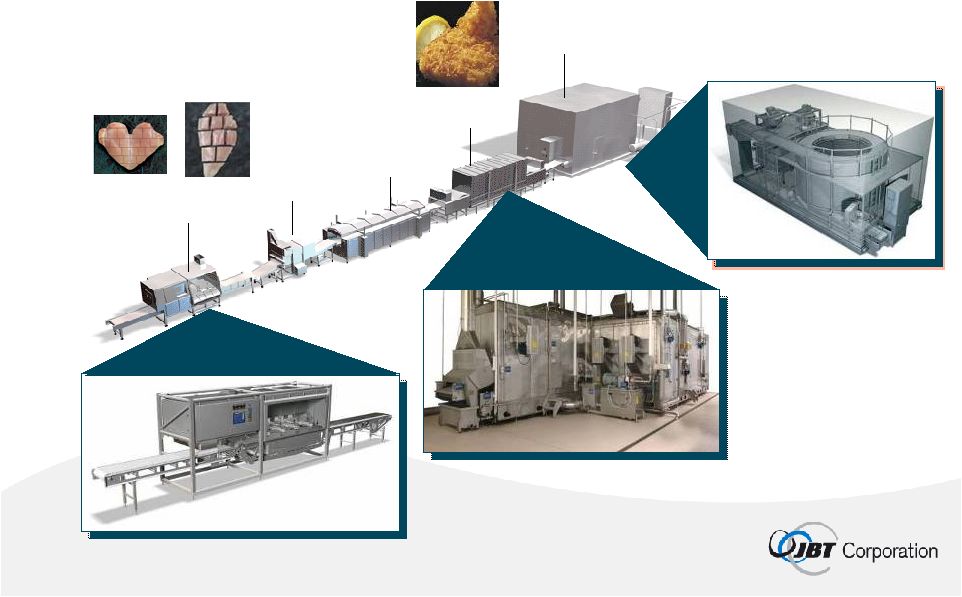 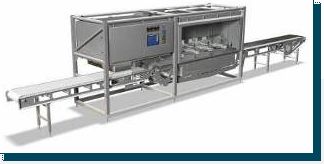  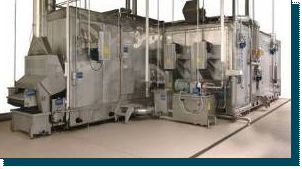  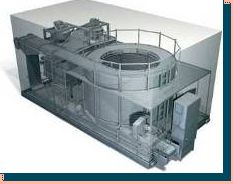 18 Higher Performance Through Continuous Innovation Coater Portioner Fryer Oven Freezer DSI Accura™ Portioning System GYRoCOMPACT-II Oven GYRoCOMPACT M-Series Spiral Freezer |
          19 Source: Rabobank Developing Markets Provide a Significant Growth Opportunity for Processed Food Technology 0 0 1 1 1 Diet Profile Survival Staples Variety Convenience High-tech Grain Roots Meat, Dairy Fruit &Veg. Prepared Foods Functional Foods Diet Component Sub-Saharan Africa Eastern Europe L. America China India Developing Markets Developed Markets W. Europe Japan USA |
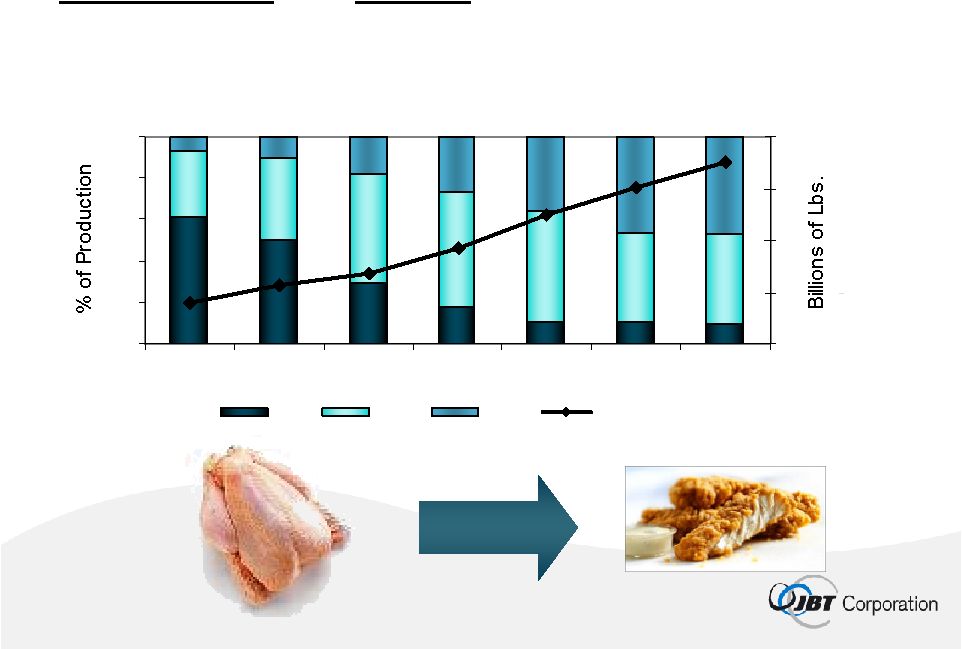 20 Convenience and Choice Drive Demand in Developed Markets U.S. Poultry Production 0% 20% 40% 60% 80% 100% 1975 1980 1985 1990 1995 2000 2005 0 10 20 30 40 Whole Cut-Up Further Lbs of Broilers Source: National Chicken Council |
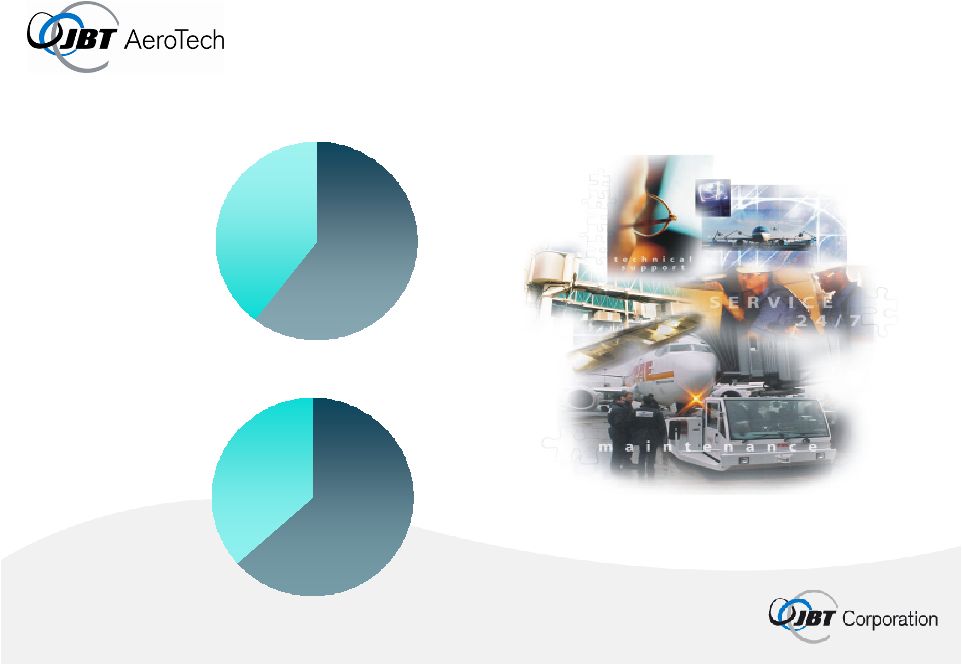 21 From Touchdown to Takeoff ™ $386MM $32MM 1. Excludes intercompany eliminations 39% FY07 Total Revenue AeroTech¹ 37% AeroTech FY07 Total Segment Operating Profit |
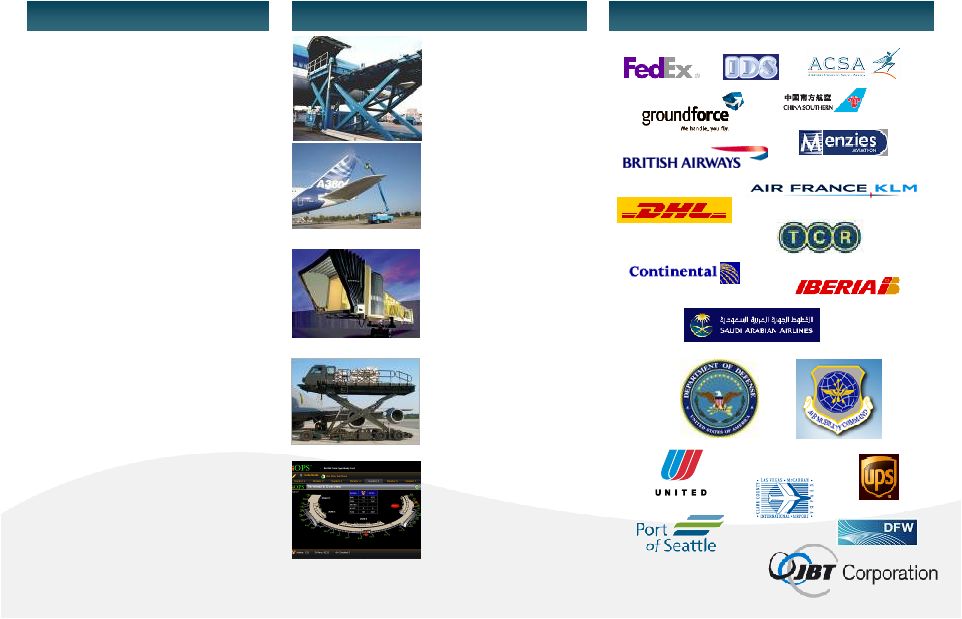 22 Ground Support Maintaining and monitoring facilities and equipment Passenger boarding Air and power supply Gate Equipment Container and palletized cargo loading Military Equipment Pushback/Towing Aircraft Deicing Container loading Cargo transporting Baggage loading Airport Services Technologies Applications Customers #1 or #2 in Core Product Offerings |
 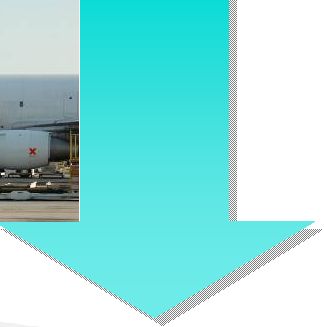  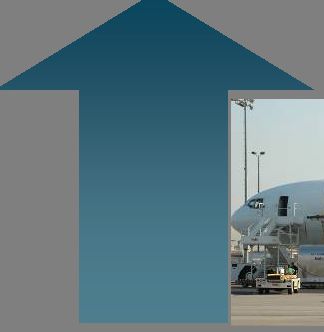 23 Turn Time Reliability From Touchdown to Takeoff ™ |
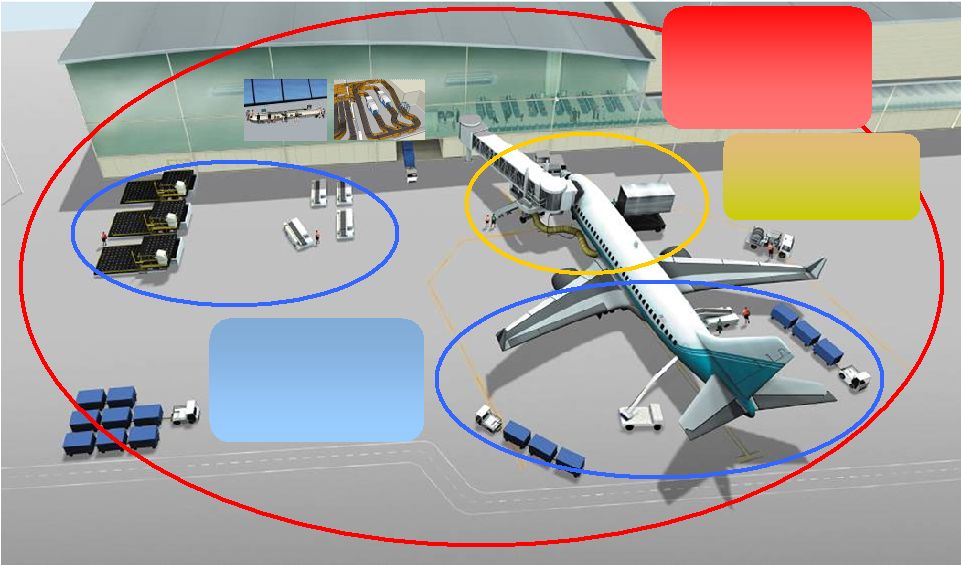 24 We Address Multiple Needs Across the Ground Support Spectrum Ground Support Equipment Cargo Loaders Deicers Aircraft Tractors Maintenance & Operation Gate Systems Baggage Handling Systems Ground Support Equipment Airport Facilities Technology Aircraft Support Systems Passenger Boarding Bridges 400Hz
Converters Pre-conditioned Air |
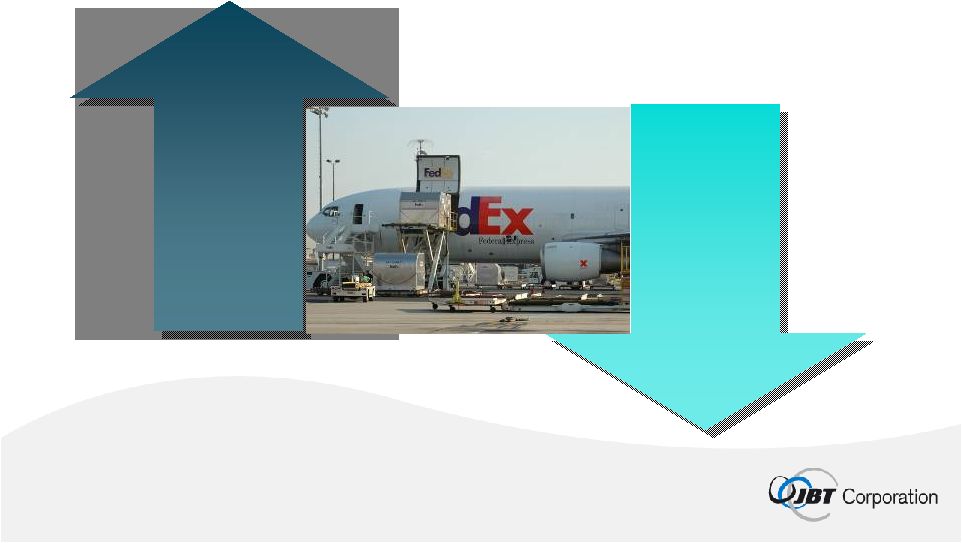
 25 Market Growth Rates: 2007 to 2027 World Economy Passengers Airline traffic Cargo traffic 4.0% 5.8% 5.0% Source: The Boeing Company, Summary Outlook 2008-2027 Long-term, Passenger and Cargo Traffic Expected to Grow Faster Than Global Economy 3.2% |
 26 • Extend technology leadership • Leverage installed base • Capture international growth opportunities • Acquisitions Well-Positioned to Capture Growth Opportunities |
 27 Financial Overview |
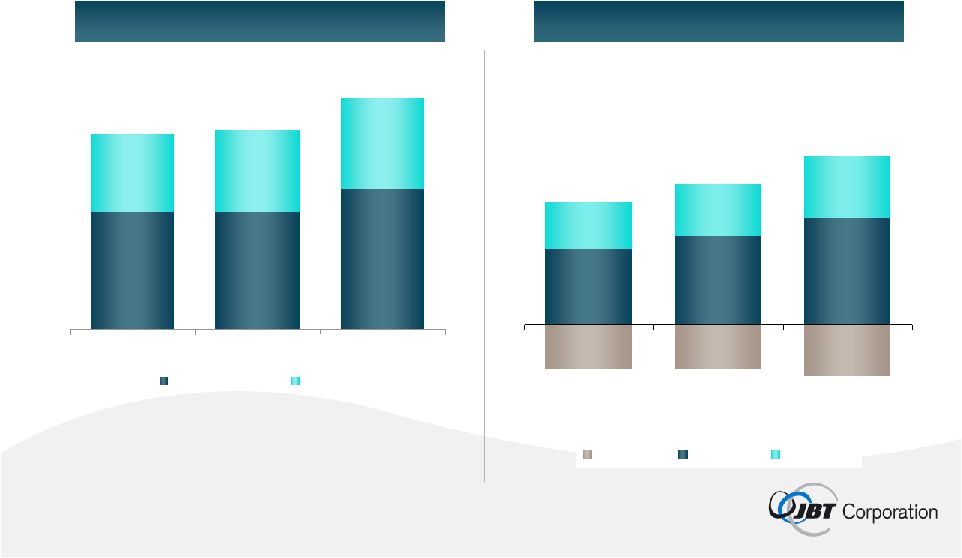 28 $497 $496 $593 $386 $327 $349 2005 2006 2007 FoodTech AeroTech $823 $978 $844 (23) (23) (27) $56 $46 $40 $27 $25 $32 2005 2006 2007 Corporate FoodTech AeroTech $42 $61 $50 Track Record of Profitable Growth Revenue ($MM) EBIT ($MM) 1. Excludes intercompany eliminations 2. See Appendix I for reconciliation of EBIT to Net Income 1 2 |
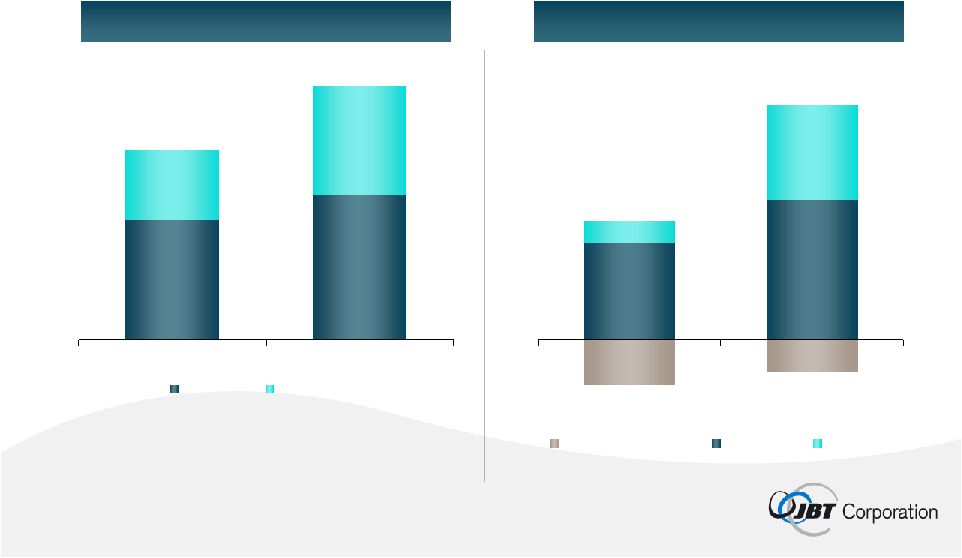 29 ($4) ($3) $13 $9 $2 $9 Q1 2007 Q1 2008 Corporate & Other FoodTech AeroTech $123 $149 $72 $112 Q1 2007 Q1 2008 FoodTech AeroTech $195 $260 $7 $19 Revenue ($MM) EBIT ($MM) 1. Excludes intercompany eliminations 2. See Appendix II for reconciliation of EBIT to Net Income Record Start in 2008 1 2 |
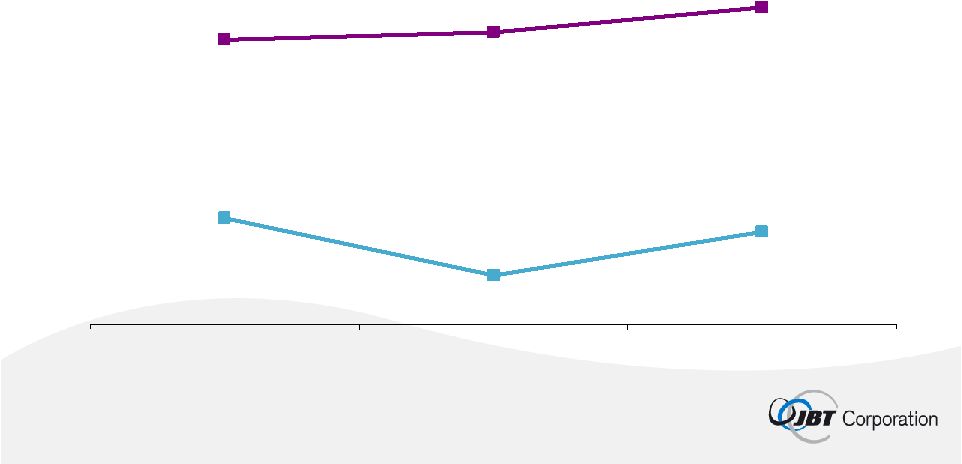 30 Efficient Working Capital Management (% of Revenue) JBT 5.4% 2.8% 6.2% Selected Industrials Mean 18.4% 17.0% 16.6% 2005 2006 2007 1. Adjusted working capital is calculated as current assets (excluding cash and short term investments) less current liabilities (excluding current portion of debt) 2. See Appendix III for reconciliation to GAAP measure 1 |
 31 Capital Expenditures¹ $1.9 $1.3 $1.2 $21.3 $21.1 $19.3 2005 2006 2007 FoodTech AeroTech $21.6 $23.0 $22.7 ($MM) 1. Total capital expenditures include corporate but not shown Capital expenditures have historically averaged ~2% of revenue
|
 32 Strong free cash flow generation 20.9 13.2 13.1 Other 2.5 (0.7) 5.5 Discontinued Operations (42.3) 28.6 (1.3) Change in Operating Assets & Liabilities (23.0) (22.7) (21.6) Capital Expenditures $23.3 $76.4 $44.3 Adjusted Free Cash Flow 25.1 $40.1 2007 23.2 22.2 Depreciation & Amortization $34.8 $26.4 Net Income from Continuing Operations 2006 2005 $MM 1. ‘Other’ contains stock based compensation, disposal of assets and other changes in balance sheet accounts 2. See Appendix IV for reconciliation of Adjusted Free Cash Flow to cash provided by operations Cumulative cash flow to Parent from 2005-2007 equal to $142.5 million 1 2 |
 33 33 20.2% 17.6% 12.5% 2005 2006 2007 1. Return on Investment (ROI) is calculated as income from continuing operations
as a percentage of average owner’s net equity Attractive Returns on Investment 1 |
 34 Debt Structure Private Placement Credit Facility Amount Term Pricing Security Covenants • $225 MM • $100 MM draw at closing • LIBOR +175 bps • $50MM swapped to 5.4% fixed rate • Customary • 5 years • Unsecured • $75 MM • 6.7% • Customary • 7 years • Unsecured |
 35 2008 Outlook • Continued top line growth – Year over year revenue increase at 6-10% • Stable segment margins • Pro Forma EPS range of $1.25 to $1.35 includes: – Full year of interest expense – Corporate related expenses in line with previous year – Effective tax rate of 38% |
 36 Investment Highlights • Experienced and diverse leadership team • Long, rich history in markets we helped develop • Technology and market leader with blue chip customer base • Global footprint with extensive capabilities • Track record of profitable growth • Large installed base drives growth in recurring revenue • Well-positioned to capture growth opportunities • Growing profits and stable cash flows support debt paydown, dividend and reinvestment |
 37 High-Productivity Solutions Engineered for Food Processing and Air Transportation |
 38 Appendix I Reconciliation of Non-GAAP measures (as required by Regulation G) (In millions) FY 2005 FY 2006 FY 2007 Net income (GAAP measure) $24.5 $34.6 $36.4 add-back: loss from discontinued operations, net of taxes 1.9 0.2 3.7 add-back: provision for income taxes on operating income 16.0 16.0 21.5 less: interest income, net (0.1) (0.4) (0.5) EBIT (non-GAAP measure) $42.3 $50.4 $61.1 add-back: depreciation expense 17.5 18.8 19.8 add-back: amortization expense 4.7 4.4 5.3 EBITDA (non-GAAP measure) $64.5 $73.6 $86.2 |
 39 Appendix II Reconciliation of Non-GAAP measures (as required by Regulation G) (In millions) Q1 2008 Q1 2007 Net income (GAAP measure) $12.3 $3.2 less: income from discontinued operations, net of taxes (0.3) 0.8 add-back: provision for income taxes on operating income 7.4 2.9 less: interest income, net (0.1) (0.1) EBIT (non-GAAP measure) $19.3 $6.8 |
 40 Appendix III Reconciliation of Non-GAAP measures (as required by Regulation G) (In millions) FY 2005 FY 2006 FY 2007 Current assets $293.9 $313.4 $369.8 Current liabilities 240.4 279.2 306.2 Working capital (GAAP measure) $53.5 $34.2 $63.6 less: cash and cash equivalents (2.7) (10.3) (9.5) less: short-term investments 0.0 0.0 0.0 less: short-term debt and current portion (0.1) (0.2) (1.1) of long-term debt Adjusted working capital (non-GAAP measure) $50.7 $23.7 $53.0 Revenue $823.3 $844.3 $978.0 Adjusted working capital as a percentage of revenue 6.2% 2.8% 5.4% |
 41 Appendix IV Reconciliation of Non-GAAP measures (as required by Regulation G) (In millions) FY 2005 FY 2006 FY 2007 Cash provided by operating activities (GAAP measure) $59.6 $96.0 $33.7 less: capital expenditures (21.6) (22.7) (23.0) Free cash flow $38.0 $73.3 $10.7 plus: net cash provided (required) by investing activities (0.1) (0.4) 7.8 of discontinued operations plus: proceeds from disposal of assets 7.0 3.1 3.1 plus: effect of exchange rate changes on cash (0.5) 0.5 0.8 and cash equivalents plus: other financing cash activities (0.1) (0.1) 0.9 Adjusted free cash flow (non-GAAP measure) $44.3 $76.4 $23.3 |
 42 Appendix V Listing of Selected Industrials Tennant Company 11. A.O. Smith Corporation 10. Regal-Beloit Corporation 9. Osh Kosh Corporation 8. NACCO Industries 7. Gardner Denver Inc. 6. Federal Signal Corporation 5. Enpro Industries Inc. 4. Briggs & Stratton 3. Baldor Electric Company 2. AAR Corporation 1. |